Bernardi Environmental Risk Index
Our Methodology and Positioning for Natural Disaster Resiliency within Municipal Bond Portfolios
White Paper, April 2026
Created By:
Matt Bernardi
Tom Bernardi
Zach Cronin
Jeremy Williams
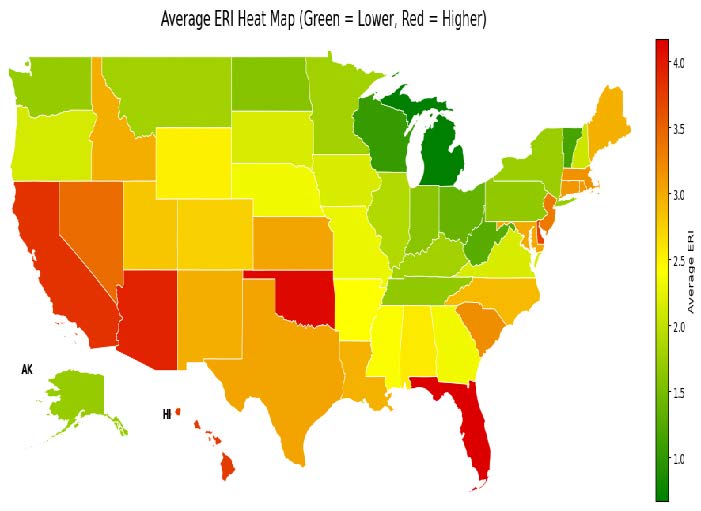
Figure 1: In the chart above, we have provided a heat map of each state’s average county-based ERI score. The higher the score, the more risk. The scale runs from red-orange-yellow-green with the former indicating higher risk vs. the latter.
Overview
Our firm has developed a proprietary Environmental Risk Index (“ERI” or the “Index”) to both measure and mitigate relative environmental risk within municipal bond portfolios. The Index assesses a county’s exposure to natural disasters and aspects of its financial resiliency – factoring in insurance non-renewal risk. We believe that a municipality’s overall resilience to natural disasters is a function of both this Index and its underlying fiscal health. ERI scores do not independently determine municipal credit risk and are complementary to our internal, single security credit analysis process.
We believe incorporating the Index into our credit analysis process is of growing importance as the cost of natural disasters continues to increase; in 2024, the US incurred approximately $182.7 billion in damages from 27 separate billion-dollar weather related disasters.1 While the cost of disasters declined in 2025, damages still totaled approximately $115 billion across 23 billion-dollar events.2 Based on these figures, the average annual cost of natural disasters has increased by approximately 3.60%-6.10% per year3 – outpacing the 2.40% rate of inflation since 2005.
Stress in the insurance market in particular regions poses a growing risk to municipal credit quality. Constrained coverage availability, rising premiums, and higher deductibles can pressure household and business balance sheets, weakening the local tax base and slowing post-disaster economic recovery. Non-renewal rates are especially alarming and deteriorating insurance conditions often signal increasing levels of underinsurance. This can materially impede rebuilding efforts and prolong fiscal strain on state and local governments following a disaster.
Lastly, the importance of measuring natural disaster risk and resiliency is further intensified by the potential for waning federal support for disaster recovery and a ballooning federal debt load. These factors could place significant fiscal pressure on state and local governments during future rebuilding efforts. A lack of federal support may also temper the pace of post-disaster economic recovery, straining tax revenues. It is important to note that the Index is a backward looking tool based on historical data, not a predictor of future events. Our primary data sources are FEMA’s National Risk Index4 and a Senate Budget Committee report5 on insurance non-renewal rates. The ERI score ranges from 0 (lowest risk) to 10 (highest risk).
1 https://coast.noaa.gov/states/stories/
2 https://www.climatecentral.org/climate-matters/2025-in-review/
3 This data is sourced from the National Oceanic and Atmospheric Administration (NOAA), which only covers events with at least $1 billion in damages. The annual growth rate is based on their average data from 2005-2015 vs. the 2024 and 2025 figures. This data can be found here: https://www.ncei.noaa.gov/access/billions/summary-stats/US/2000-2010. These calculations deserve a caveat, in that though the growth of the cost of natural disasters has outpaced inflation, this NOAA-based data could be biased towards a higher relative growth rate. Given the price level has increased drastically due to inflation, it is more likely a billion dollar event will occur today than ten, let alone, twenty years ago. As the value of property increases, so does the probability of billion dollar events used in NOAA’s data.
4 https://www.fema.gov/sites/default/files/documents/fema_national-risk-index_technical-documentation.pdf
5 https://www.budget.senate.gov/imo/media/doc/next_to_fall_the_climate-driven_insurance_crisis_is_here__and_getting_worse.pdf
ERI National Average of States: 2.48 Below is the average ERI score, by state, calculated by averaging the scores of all counties within the given state. According to the Index, Florida leads the nation in environmental risk followed by Oklahoma, Arizona, California, and Hawaii. These five states represent the highest risk levels according to our blended Index of environmental risk and insurance non-renewal rates. Notably, Midwestern states – led by Michigan, Wisconsin, Ohio, Indiana – generally have lower Index scores (less risk), averaging a score of 1.82.6
| Rank | State | Average ERI |
| 1 | FL | 4.17 |
| 2 | OK | 4.11 |
| 3 | AZ | 3.93 |
| 4 | CA | 3.82 |
| 5 | HI | 3.77 |
| 6 | DE | 3.68 |
| 7 | NV | 3.42 |
| 8 | NJ | 3.33 |
| 9 | SC | 3.19 |
| 10 | MA | 3.16 |
| 11 | CT | 3.13 |
| 12 | RI | 3.13 |
| 13 | TX | 3.04 |
| 14 | KS | 3.04 |
| 15 | MD | 3.02 |
| 16 | ID | 2.98 |
6 Illinois, Indiana, Iowa, Kansas, Michigan, Minnesota, Missouri, Nebraska, North Dakota, Ohio, South Dakota, and Wisconsin
| Rank | State | Average ERI |
| 17 | NM | 2.97 |
| 18 | ME | 2.96 |
| 19 | LA | 2.95 |
| 20 | NC | 2.89 |
| 21 | UT | 2.81 |
| 22 | CO | 2.74 |
| 23 | AL | 2.57 |
| 24 | WY | 2.52 |
| 25 | AR | 2.41 |
| 26 | MS | 2.39 |
| 27 | NE | 2.33 |
| 28 | GA | 2.33 |
| 29 | MO | 2.29 |
| 30 | IA | 2.15 |
| 31 | SD | 2.15 |
| 32 | VA | 2.15 |
| 33 | OR | 2.12 |
| 34 | NH | 2.07 |
| 35 | IL | 1.89 |
| 36 | MT | 1.78 |
| 37 | MN | 1.78 |
| 38 | KY | 1.78 |
| 39 | NY | 1.73 |
| 40 | WA | 1.70 |
| 41 | AK | 1.70 |
| 42 | PA | 1.68 |
| 43 | TN | 1.67 |
| 44 | IN | 1.62 |
| 45 | ND | 1.59 |
| 46 | OH | 1.38 |
| 47 | WV | 1.28 |
| 48 | VT | 1.15 |
| 49 | WI | 1.05 |
| 50 | MI | 0.67 |
Coastal and Gulf states consistently show elevated ERI values, primarily driven by hurricanes, coastal flooding, and riverine flooding. These regions not only face frequent hazards but are susceptible to compounding risks from sea level rise and increasing storm severity. In the interior western states and Pacific region, wildfire, drought conditions, and seismic activity drive higher ERI scores, where destructive storm potential is most prevalent. Counties with the highest ERI scores are concentrated in Southern California, the interior western states, and Oklahoma, with additional hot spots along the coastlines of North Carolina, Louisiana, and Florida.
The western United States exhibits a distinct risk profile, with elevated ERI scores largely driven by wildfires, earthquakes, and drought conditions. Counties in California, Oregon, and Washington face the highest exposure to earthquake and wildfire hazards, while mountain and arid Bernardi ERI | 5 regions are more susceptible to drought and fire frequency. Northern states deal primarily with winter storms and cold waves, though these events typically carry lower destructive potential than high-consequence hazards such as wildfires, tornadoes, and hurricanes.
Bottom Five | States with Highest ERI Score
| Rank | State | Average ERI | Key Considerations |
| 1 | FL | 4.17 |
|
| 2 | OK | 4.11 |
|
| 3 | AZ | 3.93 |
|
| 4 | CA | 3.82 |
|
| 5 | HI | 3.77 |
|