Late Year Yield Surge & 2025 Tax Reform
Happy holidays and Merry Christmas! We wish you a healthy and happy new year as we turn the page on 2024.
2024 ended as a subpar year for fixed income returns as coupon interest was offset by a late year surge in yields. The Bloomberg Municipal Bond Index[1] has returned 0.73% thus far year-to-date, after returning nearly 6.50% last year and averaging just below 3% since 2014. 2024’s flattish return is a reflection of the AAA rated 10-year municipal[2] moving from 2.26% at the beginning of the year to 3.14% today. It increased by 37 basis points in December, alone. Typically, a subpar year for bonds is followed by good performance the next year. In fact, since the Great Financial Crisis, the average return of the Bloomberg index is 8.45% following a sub 1% return in the prior year. This is in no way a prognostication for 2025, but portends well for future bond performance.
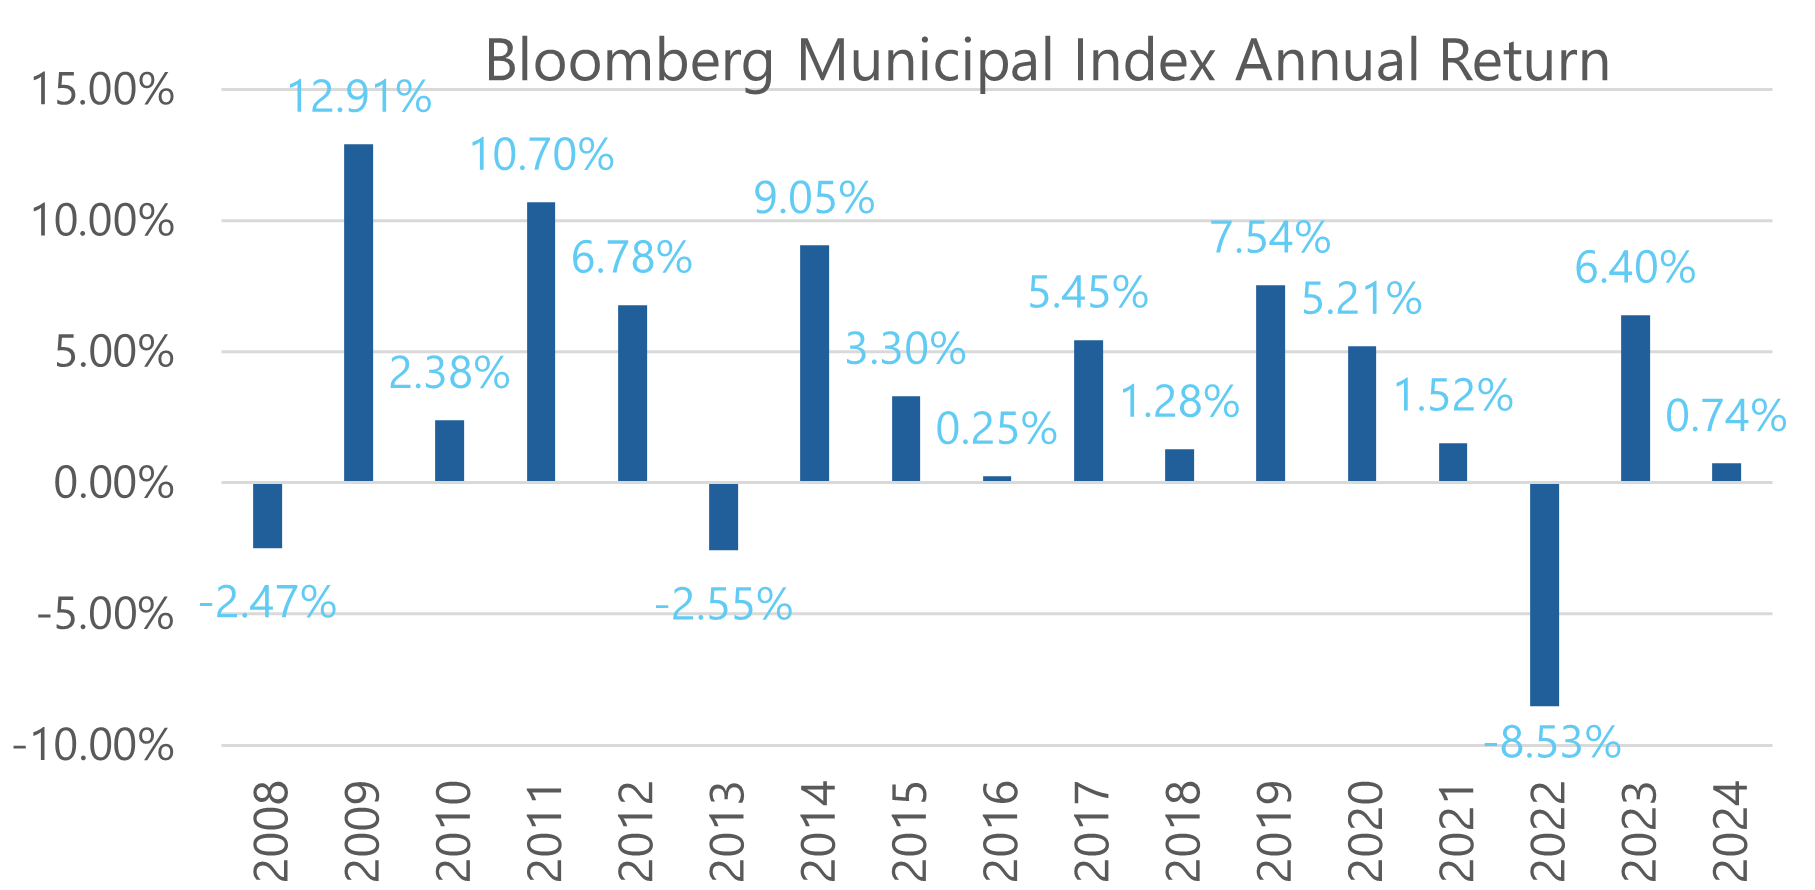
Chart Source: Bloomberg
The increase in yields this year is primarily a result of plateauing inflation, steady growth, and, therefore, the Federal Reserve is less willing to cut rates relative to prior expectations. Trump’s reelection is also cited as a factor causing weakness in bonds as of late, not dissimilar to his first election in 2016 when the 10-year treasury yield increased from 1.85% on election day to over 2.40% a month later. That post-election sell-off nearly wiped out all gains for the year, and munis finished up a paltry 0.25% in 2016. Bonds bounced back in 2017, recording a 5.45% gain, as long term bond yields ended the year slightly lower.[3]
The Fed’s Role in the Recent Selloff
Fed rate cuts are typically carried out in 0.25% (25 basis point) increments. At the last FOMC meeting the committee reduced its projection for rate cuts in 2025 from four (1.00%) to two (0.50%). It released this projection on the same day it cut the Fed Funds Rate to 4.50% from 4.75%. But because this cut was fully anticipated by the market and the pace of projected future cuts was not, rates increased during the trading day.
In fact, this has been the trend of yields since the first cut of the cycle on September 18th. Since then, the Fed has cut the short term Fed Funds rate by 100 basis points (1.00%) from 5.50% to 4.50%. During this time the longer-term 10-year treasury has moved higher to 4.55% from 3.70%.
This is an atypical relationship between the Fed Funds Rate and longer term rates at the beginning of rate cutting cycles. During the previous two cutting cycles (2019 and 2007), the 10-year was at a lower yield than where it started 100 days after the first cut.
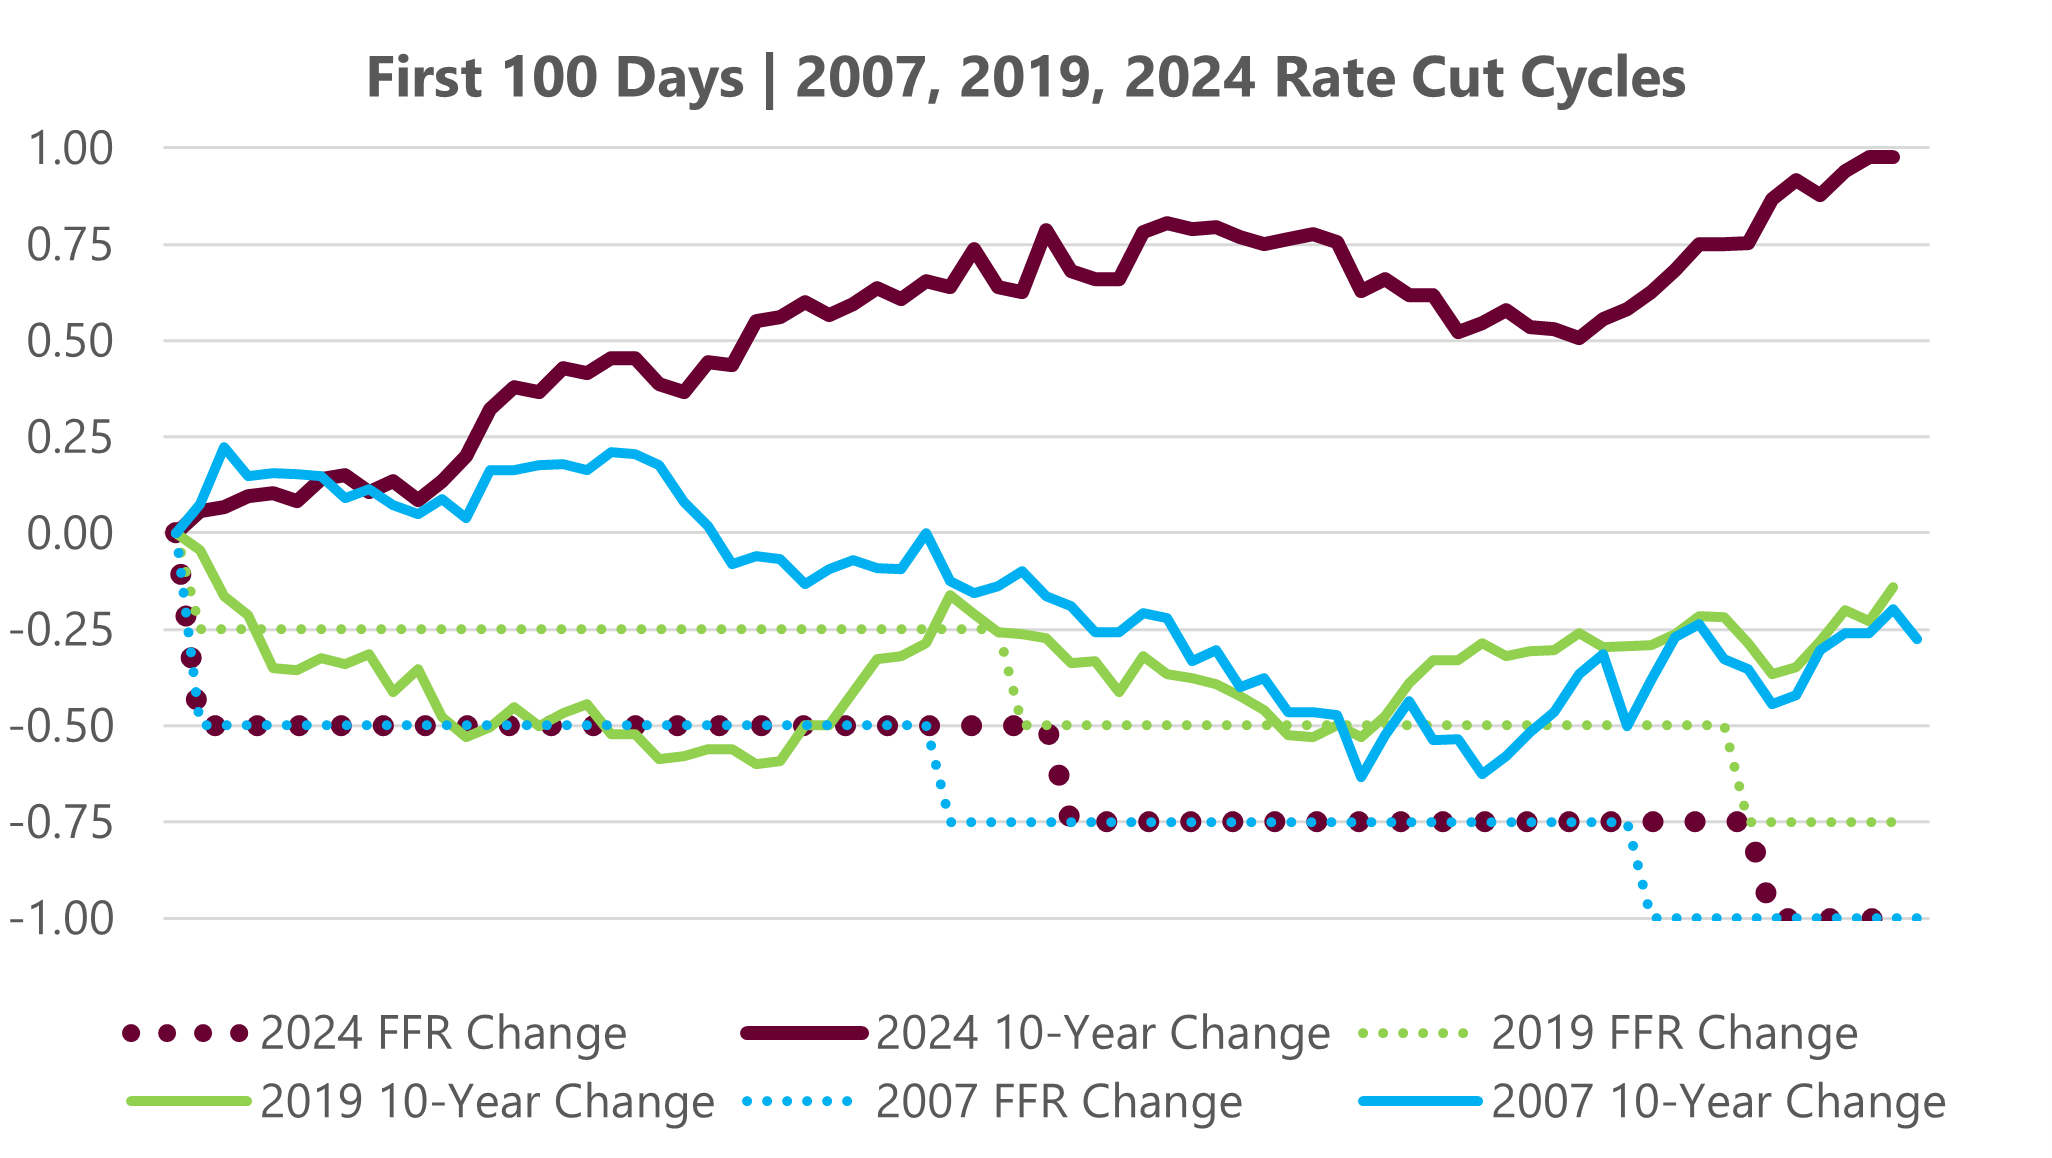
Chart Source: Bloomberg
This unique divergence between the two rates is a historical anomaly and a result of inflation that has flatlined – and in some cases picked up pace – the last three months. PCE (the Fed’s preferred measure of inflation) printed at 2.40% year-over-year in November, which was up from 2.30% in October, but down from 2.70% the previous year. During the last cutting cycle (2019) inflation moved lower over the next three months following the first cut due to a slowing economy. Today’s level of inflation remains above the Fed’s 2% target which has raised the probability of less cuts than the market previously expected and has largely underpinned this yield surge as of late.
Tax Reform’s Risk to Ratios
The municipal market digested blockbuster supply in 2024 (nearly $500 billion) and is expected to face even more in 2025. The market was unphased by the increased supply. As we noted in our October commentary, muni/treasury ratios have remained stable through the end of the year as both investor demand and high coupon repayments vacuumed up supply. Though we would welcome higher ratios, greater than 5%-6% taxable equivalent yields[4] are readily available. This will keep ratios in check unless treasuries break into the 5% yield range or supply significantly surpasses last year.
On top of supply, congressional tax policy negotiations present headline risk to the market over the next year as key provisions from the Tax Cuts and Jobs Act (TCJA) of 2017 are set to expire Dec. 31, 2025. A further decrease in the corporate rate would lessen bank demand for municipals, incrementally pushing ratios higher for bank qualified bonds. It remains to be seen where individual income brackets will settle, but we would expect them to remain unchanged at the 2017 levels, with 37% being the top bracket. Should there be a change, the risk is to the downside which would also incrementally pressure ratios higher given a lower benefit from tax-exemption.
During every tax reform cycle, the threat of removing tax-exemption reemerges. This has been measured by the CBO to “cost” the Federal government $30-40 billion per year. Historically, as negotiations pick up, Congressional representatives hear from local leaders – mayors, treasurers, city administrators, superintendents, police commissioners – about the importance of preserving tax exemption as both an efficient and highly effective way to stimulate investment into local infrastructure. Historically, this resonates, and tax-exemption is preserved and, in many cases, broadened to other types of projects. The benefits of the exemption to local districts is immeasurable and far outweighs any CBO estimate, which has false assumptions in of itself.[5]
Over $500 billion alone was raised by local towns and districts this year to fund infrastructure and the total market size is over $4 trillion. Without tax-exemption these figures would be significantly less or, if not, the tax burden on constituents would be significantly more (given higher taxable borrowing yields). For a country that already has a massive infrastructure deficit, this would put us even further behind.
What keeps tax-exempt yields relatively low for municipalities are the trillions of dollars individual investors keep invested in the market in order to secure principal and maximize after-tax income. The exemption has fostered a diverse capital market ecosystem composed of mutual funds, ETFs, separate accounts, electronic trading networks, broker-dealers, and advisors. These components enable the nexus that moves capital from investors seeking tax-exempt income to local projects that need low-cost financing.
Because projects are financed in a decentralized fashion by investors, the pricing mechanism is market-based and measured in yield. Yields are in large part derived by an obligor’s credit worthiness which is a measurement of how well they spend your tax dollars. Better management means lower yields, which means lower taxes and/or better local infrastructure and services for constituents. This aspect of the market keeps a lid on “bridges-to-nowhere” as dollars need to be paid for by the local population and local leaders’ reputation is on the line.
This decentralized, market-based feedback loop is enabled by tax-exemption with no federally centralized party dictating how or to whom capital should be allocated for local projects. The two most important inputs for if a project gets off the ground are need and ability to pay, rather than some sort of political connection or special interest group securing funds for a project.
Without tax-exemption, local taxes would be forced to increase, projects paired back, and the solicitation of funds from the central government greatly increased. With the latter, local control and, therefore, efficiency declines. Projects would be decided and financed less based on local input and fiscal judiciousness, and more on who has power in D.C. Not only is this a less efficient allocation of tax dollars but it also reduces community involvement, the bedrock of our federal republic.
If credit health is any indication of how well this market works, notice that 32 states are rated by Moody’s at Aa1 or better, which is equal to or better than the U.S. government! Only two states (Illinois and New Jersey) are rated below Aa3, demonstrating fiscal mismanagement is an infrequent bug, not a feature, in this market.
The benefits of tax-exemption cannot just be measured in dollars alone and we expect its importance to be highlighted and preserved throughout the tax negotiation process.
Thank you for your confidence in our team during 2024 and we look forward to working with you in 2025!
Sincerely,
Sr. Vice President
[1] Source: Bloomberg (LMBITR Index) as of 12/30/2024; Bloomberg Municipal Bond Index Total Return; duration 6.33, Time to Mty: 13.57
[2] BVAL Muni AAA
[3] Source: Bloomberg
[4] Assuming a 37% bracket
[5] For example, the CBO estimates that every dollar invested in tax-exempt securities would be reallocated to taxable securities/strategies.
Disclosures: All information has been obtained from sources believed to be reliable, but its accuracy is not guaranteed. There is no representation or warranty as to the current accuracy, reliability or completeness of, nor liability for, decisions based on such information and it should not be relied on as such. The views expressed in this commentary are subject to change based on market and other conditions. These documents may contain certain statements that may be deemed forward looking statements. Please note that any such statements are not guarantees of any future performance and actual results or developments may differ materially from those projected. Any projections, market outlooks, or estimates are based upon certain assumptions and should not be construed as indicative of actual events that will occur. Past performance is no guarantee of future returns. Different types of investments involve varying degrees of risk. Therefore, it should not be assumed that future performance of any specific investment or investment strategy will be profitable.