No, not bonds versus stocks – nor the long-standing Chicago bar. Stocks and bonds are complementary asset classes, not competing ones. In fact, traditional portfolio theory emphasizes combining them through asset allocation to balance risk and return.
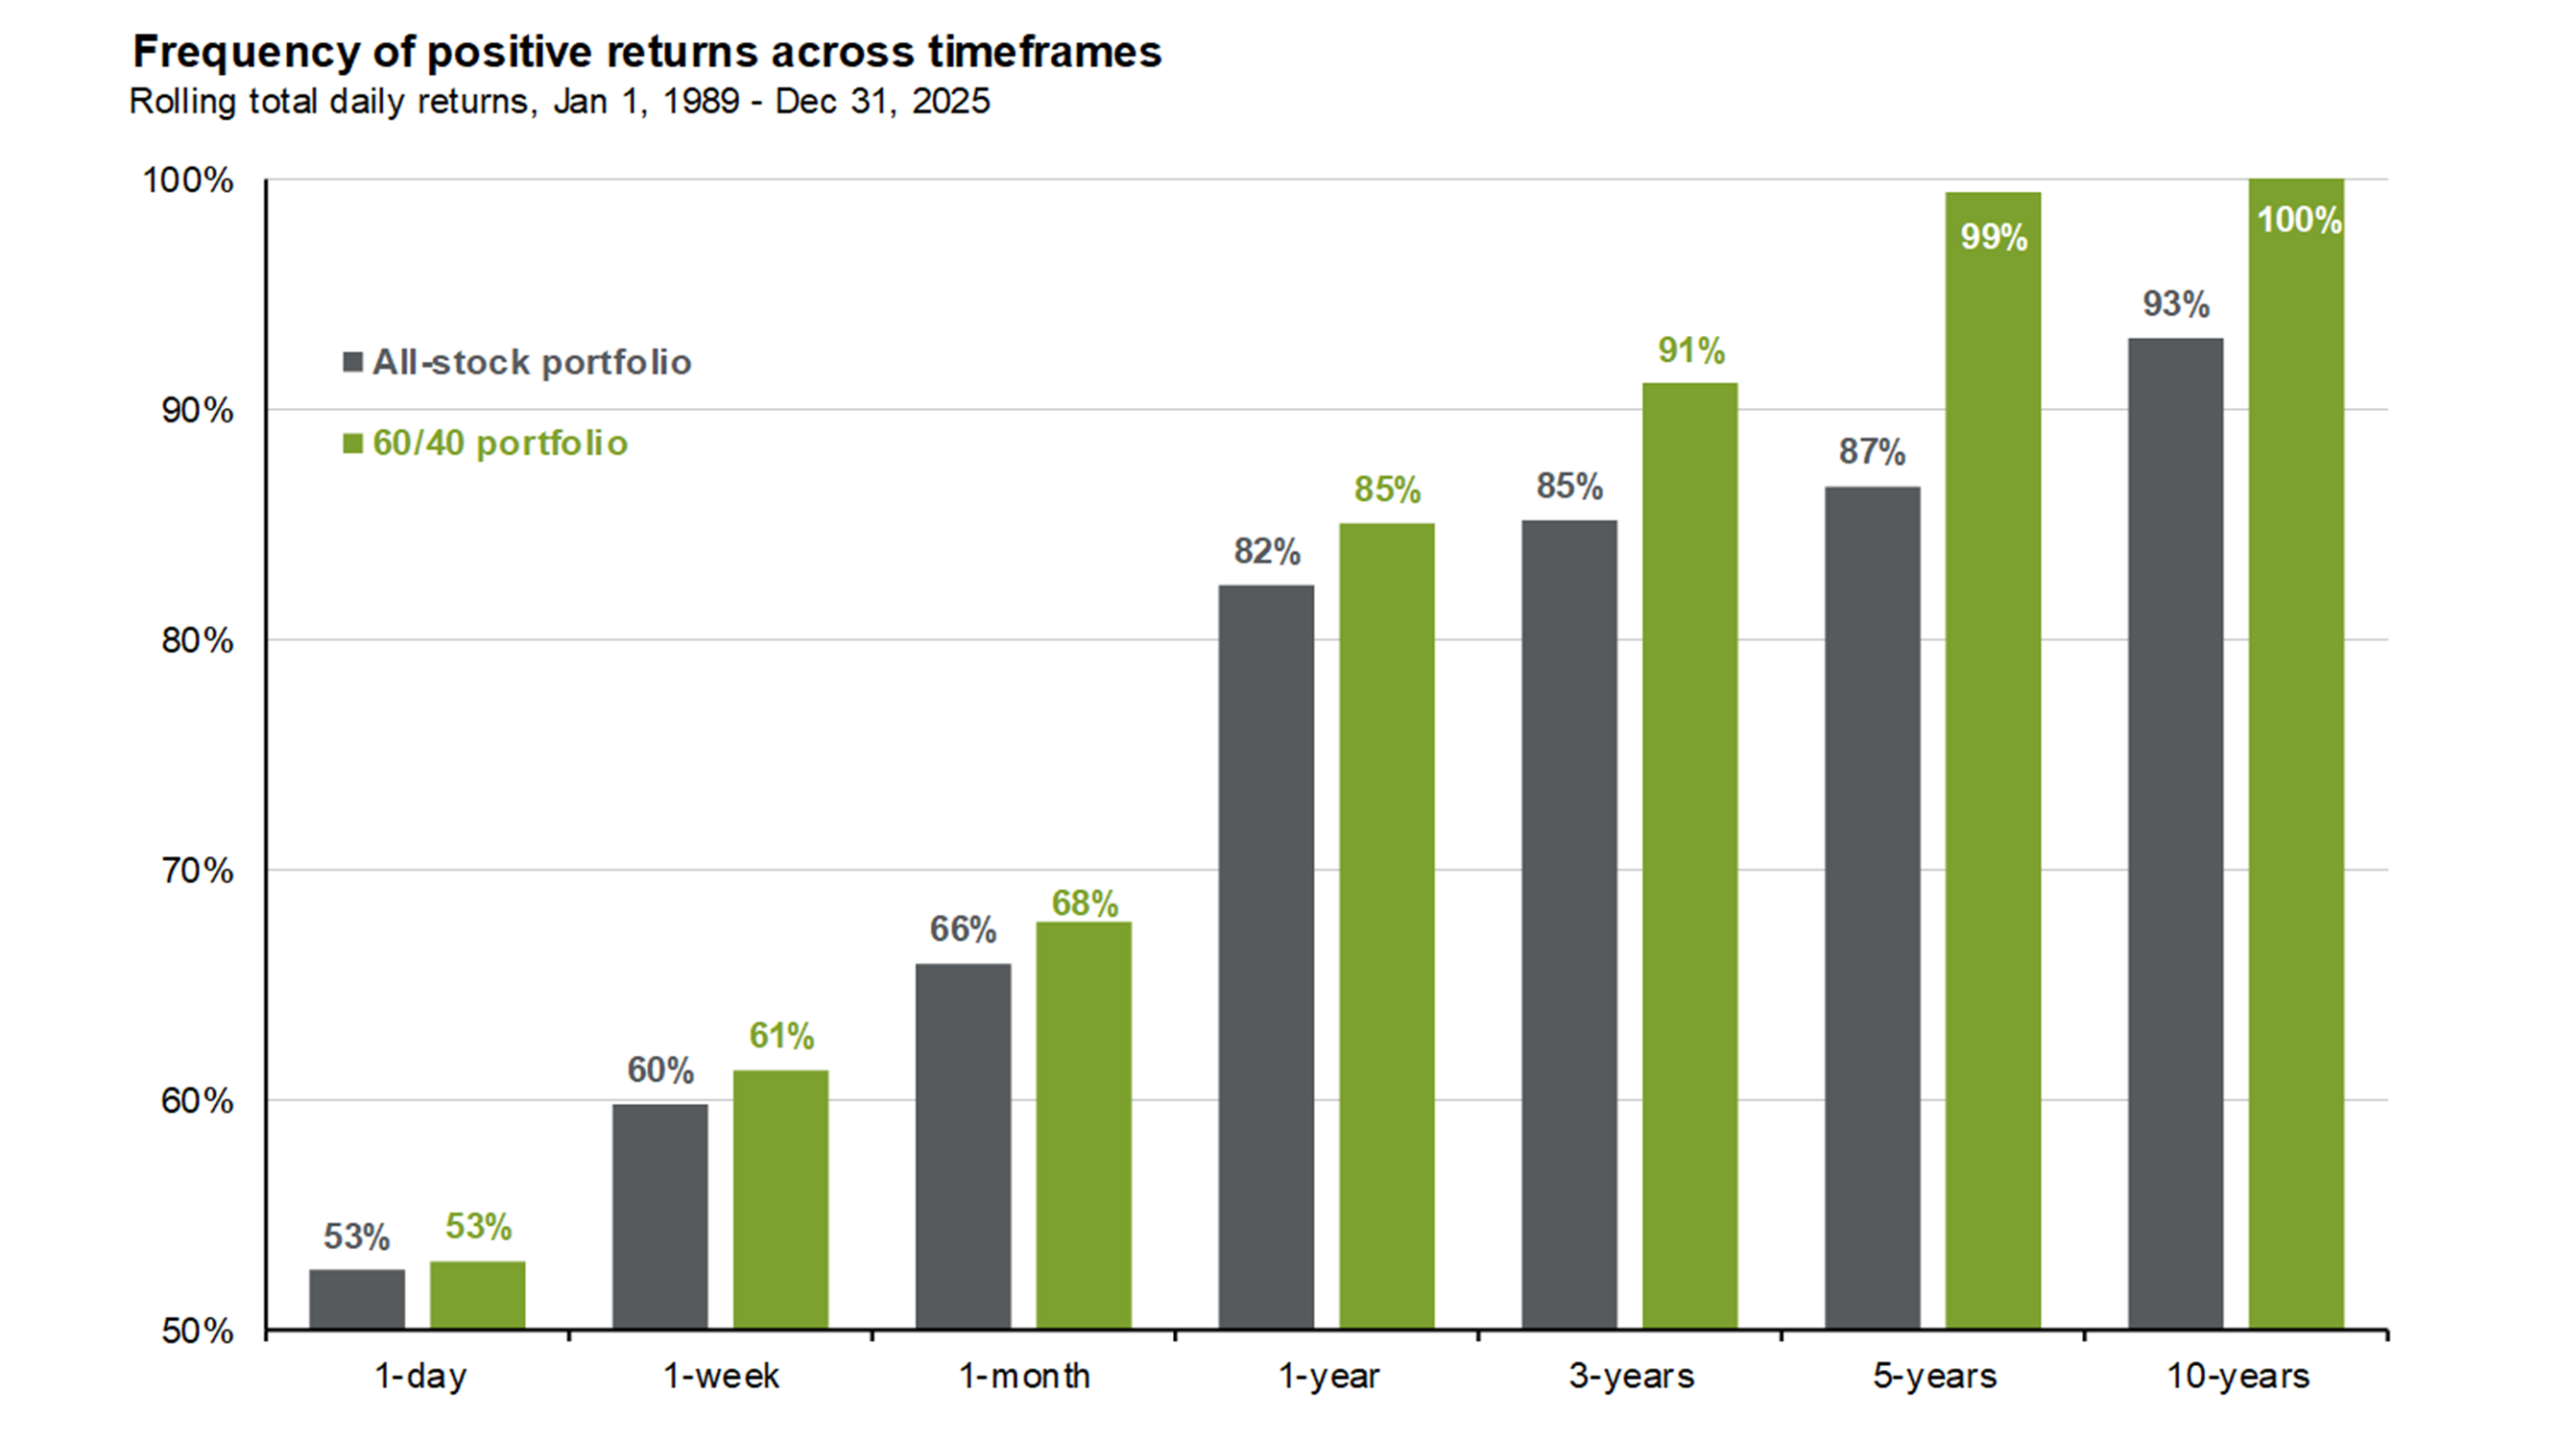
In J.P. Morgan’s recent Guide to the Markets (always worth a read), they noted a diversified 60/40 portfolio delivered positive returns more frequently than an all-stock portfolio across every rolling time frame, from one day to 10 years.[1]
The data suggests that as the investment horizon gets longer, the role of bonds becomes increasingly more important. They help reduce volatility and increase the frequency of positive returns.
It’s not that bonds necessarily outperform stocks, but they serve as a consistent ballast to offset and complement stock returns. For us ephemeral and/or risk-averse beings, this consistency may be a critical facet as to why you allocate to fixed income.
The S&P has returned 15% per year over the last 4-years[2], and is currently near all-time highs. The Bloomberg Global Aggregate Index is up 1.50% per year during that same period. As we’ve mentioned in the past, bond returns have been dragged down by the 2020-2022 period of significant rate hikes and low starting yields. This was a double-edged sword for the past performance of bonds.
“A diversified 60/40 portfolio delivered positive returns more frequently than an all-stock portfolio across every rolling time frame, from one day to ten years.” — J.P. Morgan Asset Management, Guide to the Markets, Q2 2026
However, basing your future return assumptions on the past is like driving a car using the rearview mirror.
Looking Forward
Projected returns for stocks and bonds are quite dissimilar at the moment. Bond yields are back to 20-year highs, meaning their projected returns could be interpreted as being at 20-year highs – as yield is the main driver of fixed income returns.
However, due to the immense run in stocks and current elevated valuations, many stock forecasting models are not as optimistic on their outlook.
J.P. Morgan’s Guide to the Markets (as of 3/31/2026, when the S&P was trading significantly below current levels) noted the following stretch in equity valuations:
S&P 500 Valuation Metrics vs. 30-Year Averages (as of 3/31/2026)
| Metric | Reading |
| Forward P/E vs. 30-Year Average | 14.5% above |
| CAPE Ratio vs. 30-Year Average | ~30% above |
| Dividend Yield vs. 30-Year Average | 0.40% lower |
Several respected frameworks currently project modest equity returns over the coming decade:
- Nobel laureate Robert Shiller’s CAPE ratio model forecasts average annual total returns of just 1.3% over the next decade, including dividends. On a price-only basis, his model implies negative returns.[3]
- A recent academic study incorporating earnings and revenue data argues the S&P 500’s expected return over the next decade is around 3% per year — below the current 10-year Treasury yield.[4]
- Research Affiliates founder Rob Arnott forecasts roughly 3% annualized returns, citing a modest 1.2% dividend yield, earnings growth likely to slow to about half its recent pace, and a meaningful contraction in price-to-earnings multiples.[5]
Additionally, Arnott in a 2009 article “Bonds, Why Bother?” (Journal of Indexes, May-June 2009[6]) made the following points:
- “Stocks have not outperformed bonds for the last 40 years” [note the 2009 article date]
- An investor in 20-year Treasuries (consistently rolling to the nearest 20-year bond reinvesting income) outperformed the S&P 500 “starting any time we choose from 1979 through 2008.”
On January 2nd, 1979 the 20-year Treasury yield stood at 9.00%.[7] Today, it yields roughly half of that, approximately 4.99%.[8] This matters because bond returns are mathematically anchored to their starting yield. So certainly, there is a shorter “runway” when compared to 1979’s yields.
But a shorter runway does not mean yields are unattractive. The 30-year treasury is near its highest level since 2000. It currently trades at 5.00%, meaningfully above its 26-year average of 3.90%. High-grade municipal yields range from 4% to 4.50% on the intermediate to long end, translating to taxable equivalent yields of 6.34%-7.14%.[9] That taxable-equivalent figure represents approximately two-thirds of long-run equity returns, with substantially lower volatility and far shallower drawdown risk.
The basic principle here is straightforward: when yields are higher, forward-looking bond returns are higher. Today’s yields are not 1979, but they are the most attractive entry point in a generation.
Decades of Bond Outperformance
Arnott goes on to note that bonds outperformed stocks in the following time periods:
- 1803-1871, 68 year span
- 1929-1949, 20-year span
- 1968-2009, 41-year span
The second and third periods are vulnerable to the charge of cherry-picking. Both are bookended by some of the worst financial crises in American history — the Great Depression defined the 1929–1949 window, while the 1968–2009 period closes on the Great Financial Crisis. It is reasonable to argue that selecting endpoints at or near market bottoms is a convenient way to make equities look worse than they are over the long run.
That criticism has merit, but only to a point. Even granting the endpoint selection, we are still talking about 20- and 41-year periods during which bonds outright outperformed stocks. A 41-year period of bond outperformance spans entire careers and investing lifetimes.
The standard belief is that equities outperform over a long enough time horizon, and the data broadly supports this. Over a forever spectrum, equities should outperform. However, none of us are forever. Most investors don’t have 50- or 70-year time horizons. They have finite working years, finite retirement savings, and a very real aversion to watching their portfolio fall 30 or 40 percent — even if temporary.
That is where bonds play a critical role. They step in to stabilize – and outperform at times – the rest of your portfolio.
Key Takeaways
This is not intended to fearmonger about the stock market, let alone predict we are in store for a period of bond outperformance. Instead, it serves as a reminder of a few key principles:
In Summary
- – Recent bond underperformance was a historic anomaly. The low returns of 2020–2022 were driven by a unique rate environment, not a structural shift. Looking ahead, bonds are more likely to perform in line with the past 1–3 years (3–5%), given today’s higher starting yields.
- – Higher yields mean higher expected returns. Starting yield remains the primary driver of forward-looking fixed income performance — and today’s yields are the most attractive in 20+ years.
- – Diversified portfolios improve outcome consistency. A portfolio balanced between stocks and bonds significantly increases the probability of positive returns across any time horizon — particularly over longer periods.
- – Bonds can outperform stocks over meaningful stretches. While equities likely lead over very long horizons, history shows extended periods where fixed income delivered superior results.
Thank you for your confidence in our team. Please reach out to your Investment Specialist or Portfolio Manager with any questions.
Matt Bernardi Sr. Vice President, Bernardi Securities
[1] J.P. Morgan Asset Management, Guide to the Markets, U.S. | 2Q 2026, as of March 31st, 2026. [2] Source: Bloomberg, May 4th, 2026 [3] https://www.fool.com/investing/2026/04/12/sp-500-in-10-years-nobel-laureate-robert-shiller/ [4] https://papers.ssrn.com/sol3/papers.cfm?abstract_id=5142047 [5] https://fortune.com/2026/03/17/spx-stock-market-future-returns-outlook-warning/ [6] As noted in Bonds: The Unbeaten Path to Secure Investment Growth by Hildy and Stan Richelson, page 16. [7] https://fred.stlouisfed.org/data/DGS20 [8] Bloomberg, May 5th, 2026. [9] Calculated at the 37% federal tax bracket