Apparent Risk in Municipal Bond Land
In December 2019 we released Unapparent Risk in Municipal Bond Land which recapped a solid year of performance and warned investors of the underlying risks within the municipal market.
We did not expect those risks to come to fruition so quickly, but they certainly became apparent three months later last March. We are gratified in many instances that our positioning of clients’ portfolios provided safeguards against the risks we highlighted, and, in many cases, our portfolio management strategy allowed us to take advantage of market dislocation to the great benefit of portfolios. As we view the market at the end of 2020 we are wondering if it has a similar shape and feel and presents news risks for municipal bond investors due to the impact of the COVID-19 health and economic crisis.
Two of the risks we discussed (i. investment vehicle and ii. “yield hunting”) came to fruition in March when significant dislocation and underperformance occurred in the mutual fund/ETF and lower-grade municipal sectors. We believe significant risk continues to exist in these areas because COVID has exacerbated the conditions of many fiscally mismanaged municipalities and we strongly feel “mattress-money” holdings should avoid these credits. Allocating capital to issuers that are well managed, essential purpose and/or essential revenue bonds – in a separate account portfolio – is the best way to preserve and grow your mattress-money allocation.
2020 has reminded us of many things and certainly these lessons are a silver-lining in a challenging year. Within municipal bond-land we are reminded that, once again, our targeted municipal sectors stand the test of time and hold up during volatile and rough economic climates.
As at the end of 2019, investors are faced with a low-rate environment. So, while the temptation to take on risk through a higher allocation to sub-par credits, high duration securities (long maturities), leveraged assets, or alternative municipal investment vehicles is understandable – it should be avoided.
A Year in Review
In 2020 the market was certainly tested in both price and credit. In terms of price, at the end of 2019 we asked: “What will the bid market look like…when a large number of funds need to sell similar holdings simultaneously? Will these investment vehicles offer good liquidity and avoid fire sale price selling in this possible scenario?”1
In March, many fund investors received the promised “liquidity” – BUT AT FIRE SALE PRICES. In at least one case, the parent company of a large mutual fund provider was forced to step in and provide liquidity (use its own capital) to its underlying mutual funds. This event underscores that liquidity is a two-parted measurement. The ability to click a “sell” button and dispose of your shares is a form of “instant” liquidity, but at what price are the shares sold? A fund does not necessarily give you this transparency, nor protect you from selling at an unreasonable price/yield/valuation – unlike a well-managed SMA strategy.
If you or other investors seek liquidity from a mutually owned investment vehicle, that fund must inevitably sell a portion of the underlying holdings. So, on the front end you have a “stock-like” sale that the retail investor experiences, but on the backend the actual value you realize is handled similarly to how any municipal bond is traditionally sold. This disconnect between the investors’ “liquid” sale experience and the ultimate sale of the asset, was exacerbated in March when the front-end retail investor selling outpaced the back-end ability to disburse assets and raise cash from fund providers.
March may have been unique in its scale, but this type of market displacement is not uncommon. We have experienced significant price dislocations every 3-4 years…
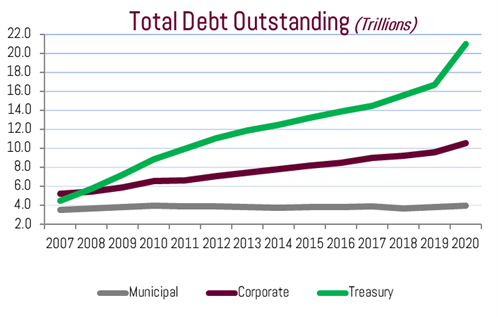
Mutual fund/ETF assets have grown significantly, while the number of firms on the bid-side/back-end (broker-dealers and market makers) has shrunk. This factor contributed greatly to the sell-off last March – the most significant of the past twenty years – and is likely it to occur again. There simply was not enough dry powder to take on the waterfall of fund selling.

In mid-to-late March the iShares National Muni Bond ETF2 (chart to the right, ticker: MUB) traded at a significant discount, and then premium, to the value of the underlying holdings. This means, as a seller of the fund in mid-March you were selling the ETF at a discount to where the actual underlying holdings were trading in the municipal marketplace. At one point this discount was 5.76%. Again, liquidity was realized through the instant sale on one’s computer screen…but at what price to the investor?
In times of such market stress, an SMA is not forced into selling and if portfolio liquidity (cash, short maturities) is available, can take advantage of these market dynamics. Additionally, as a liquidity provider, we strive to avoid clients selling bonds at irrational levels, thereby delivering value when liquidity is needed.
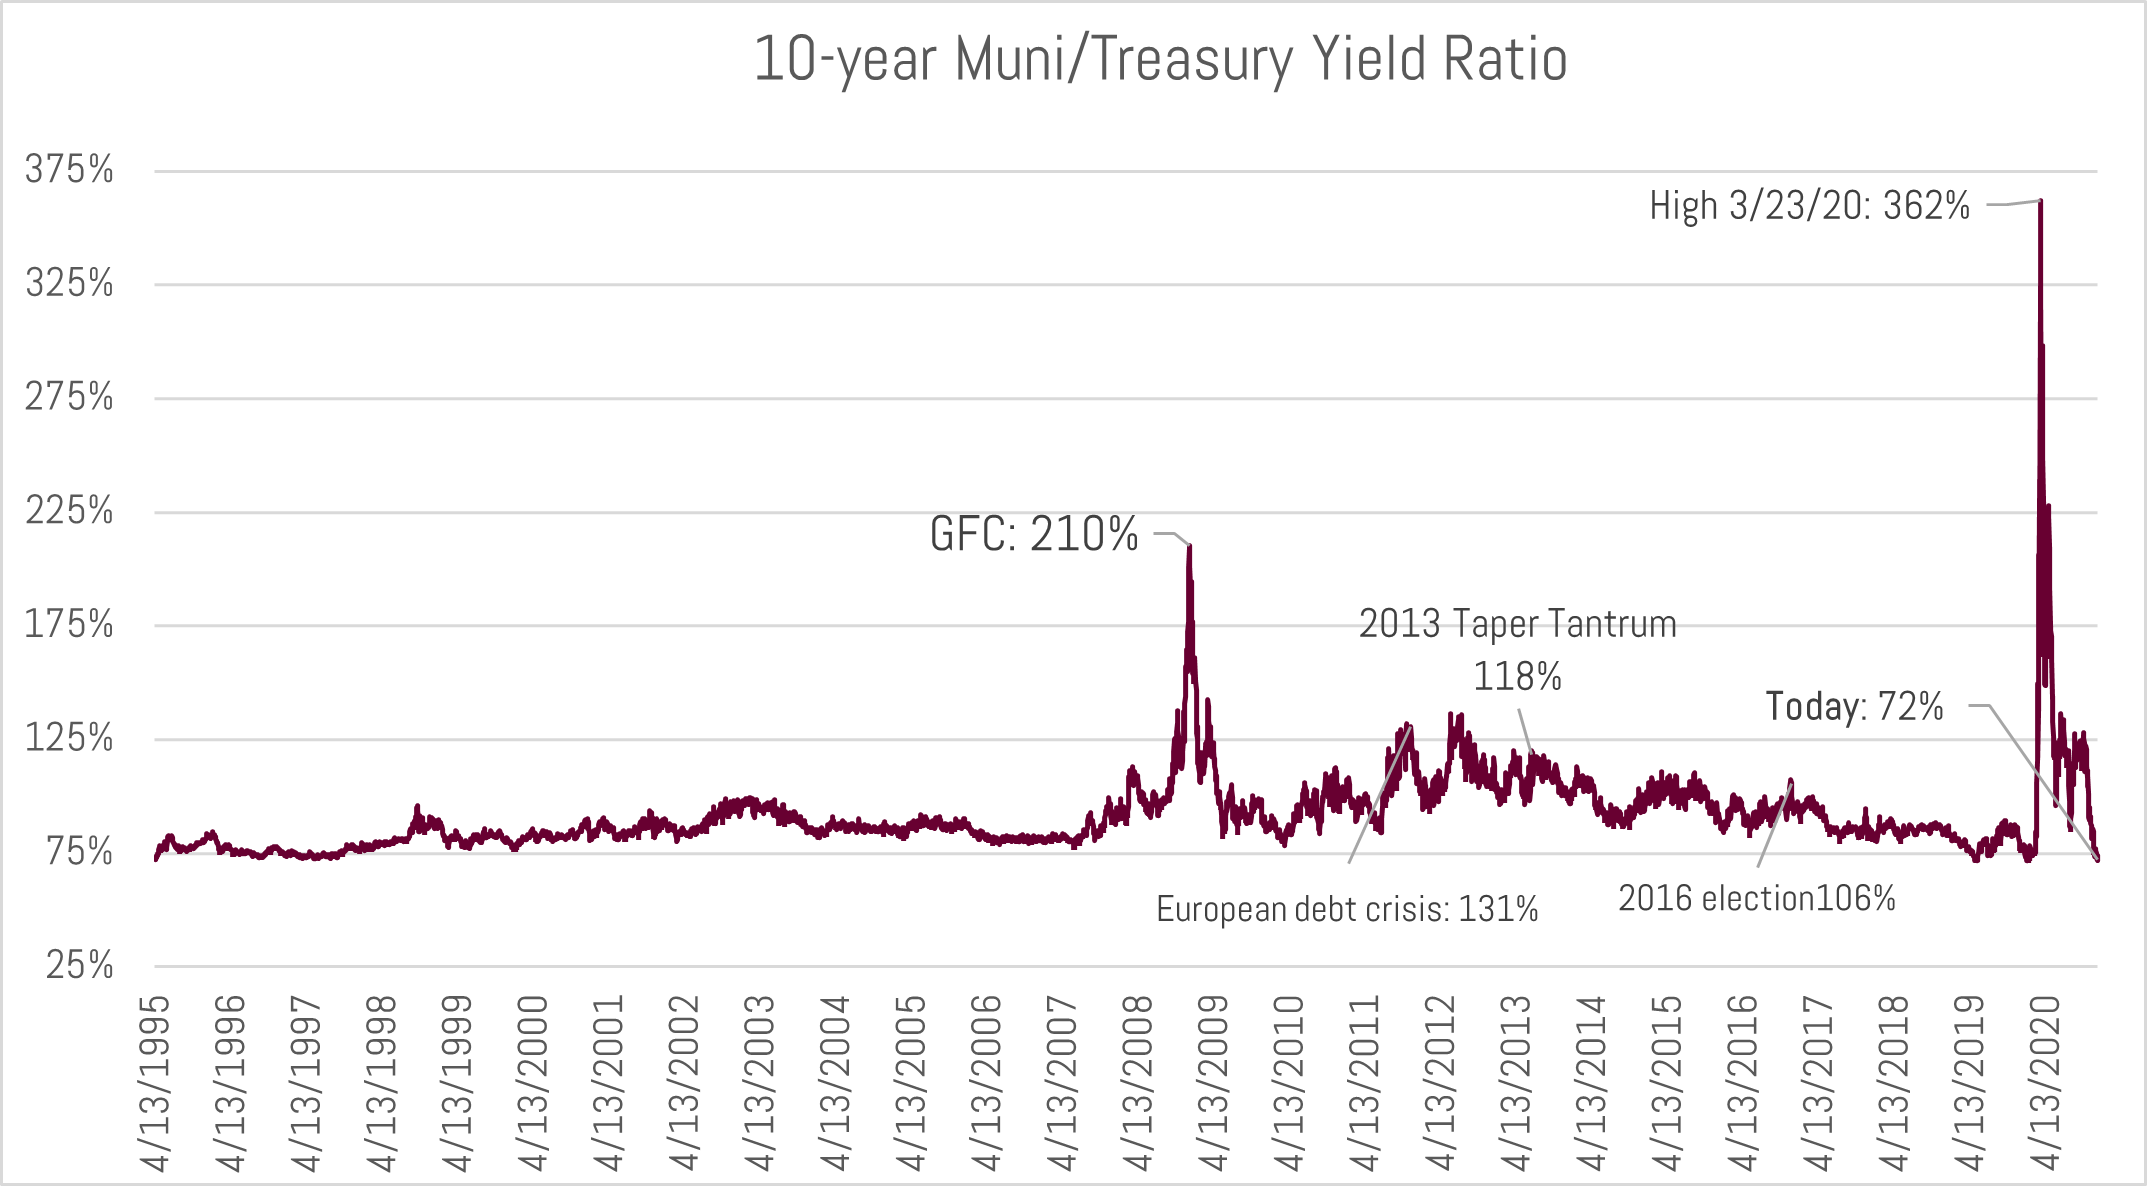
March may have been unique in its scale, but this type of market displacement is not uncommon. In recent times the market has experienced significant price dislocations every 3-4 years including 2008-2009 (Great Financial Crisis, GFC), 2010 (Meredith Whitney), 2013 (Taper Tantrum), and 2016 (Presidential Election). We believe the average client portfolio at Bernardi remains on guard and well-positioned to take advantage of similar environments in the future – which we welcome to opportunistically take advantage of for client portfolios.
 Source: Bloomberg
Whereas the selloffs in 2013 and 2016 were not underpinned by credit concerns, March’s sell-off was induced in large part by an underlying concern about the credit health of the average municipality. This was very much like 2008-2009 when investors feared a severe economic contraction would blow insurmountable holes in municipal balance sheets.
To date, the COVID-19 induced economic crisis has played out on a national scale similarly to how a natural disaster impacts a local economy. During such disasters, areas experience an acute economic contradiction, followed by a sharp recovery. Importantly, Moody’s has noted that natural disasters have not been the cause of a single default in the history of the municipal bond market.3 2020 has played out similarly for your average municipal credit.
Though particular sectors (restaurants, hospitality, airports, and nursing homes) continue to face the acute phase of this crisis, the underlying sources of revenue for many municipalities (property, income, sales tax) have not been severely hampered compared to 2019. In many cases, spending has been reallocated between sectors, maintaining overall stability for municipal sales tax revenue. Furthermore, most issuers have various fiscal levers to pull and revenue raising abilities (i.e. raise taxes) when faced with projected revenue shortfalls. Lastly, our portfolios favor suburban and rural issues, which have benefited through increased demand for housing (high property prices = more property tax revenue) at the expense of city-dwellings.
2021 Outlook: General Stability but Headline Risk Remains
Though 2020 ended calmly for the municipal market, COVID-19 is still with us and its economic scars will linger for some time. The underlying economy has been significantly assisted by both fiscal and monetary policy stimulus, which will likely have less of an impact in 2021. Additionally, the elevated unemployment rate will dampen consumer spending and economic growth.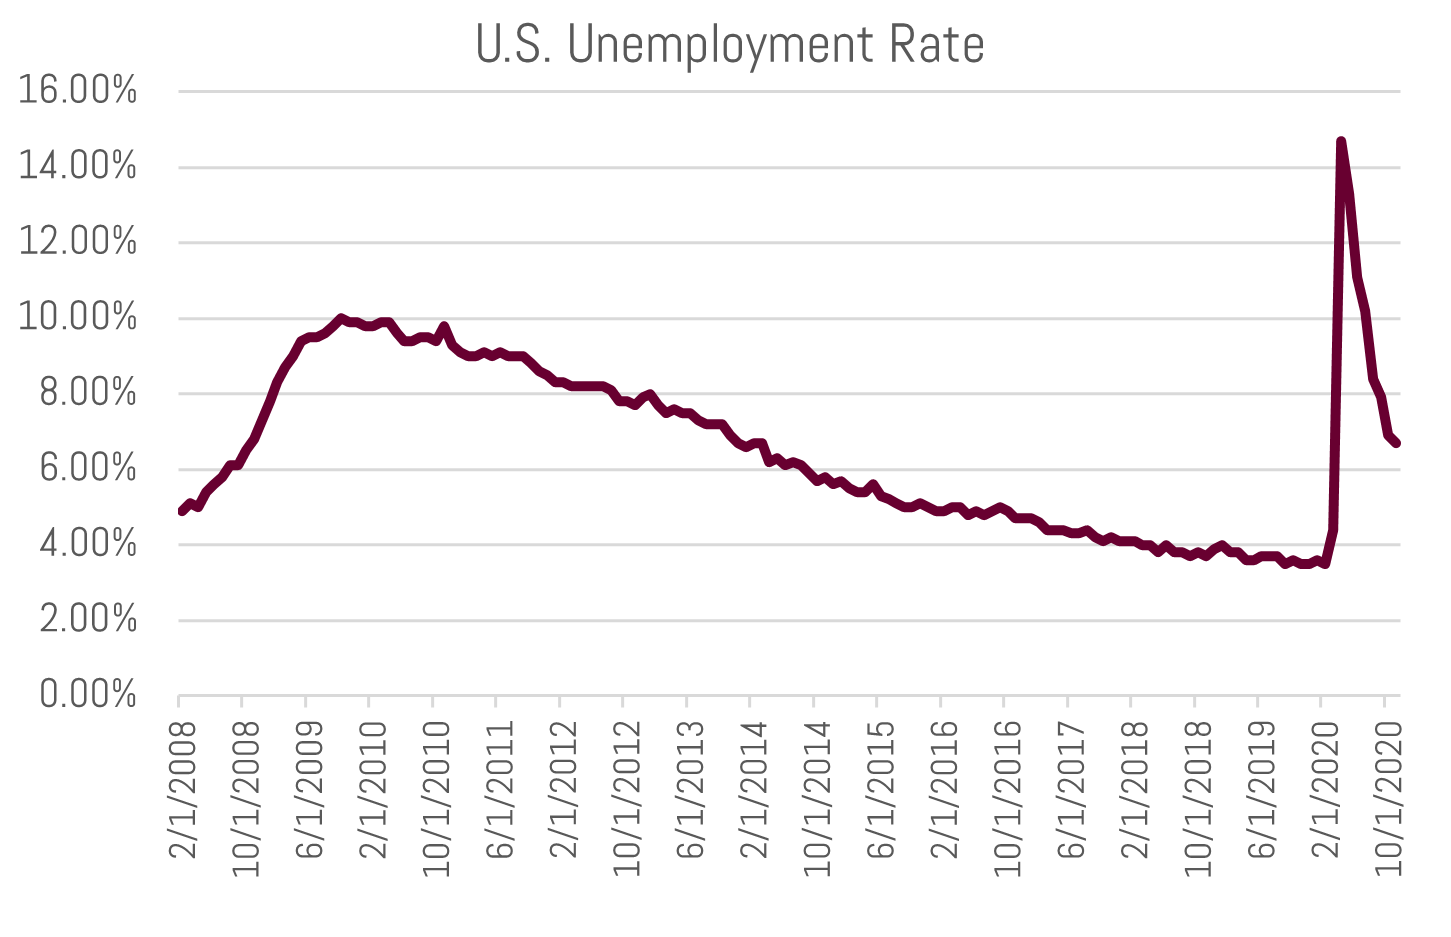
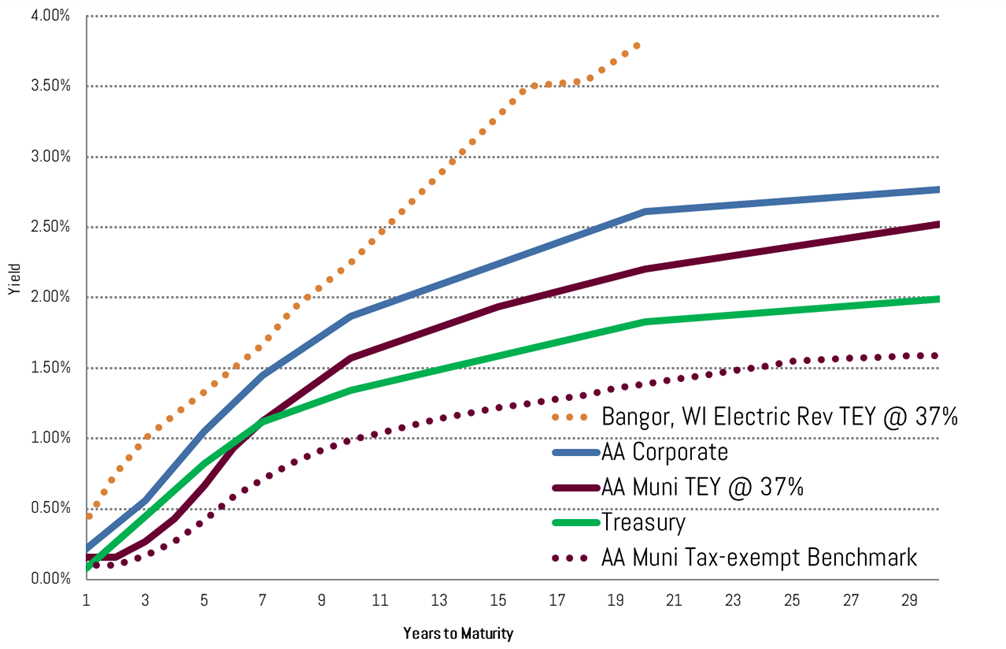
Given the low-rate environment and early innings of an economic recovery, we believe now is a time to practice patience and not increase risk through buying lower rated issuers/sectors or significantly increase duration. Should the current rate environment continue into the spring and if you are seeking a portfolio strategy offering higher income, we encourage investors and their advisor to look into our High Income Strategy to enhance the underlying yield of their portfolio without sacrificing credit quality.

Apparent Risk in 2021
Risk 1: Sacrificing credit quality for an increase in portfolio yield is one of the main risks we see for 2021. Generally, there are two ways to increase yield by investing in issuers with lower levels of credit health:
- Invest in bonds that have economically sensitive and/or concentrated underlying sources of revenue.
- Invest in geographies (states/cities/etc.) faced with structurally imbalanced budgets and poor underlying economic conditions (low growth and/or high taxes). Typically, the biggest overhang for these types of issuers are pension obligations and either an inability or unwillingness to reform and contribute higher levels of funds to close the liability shortfall. If investment returns do not match the projected rates of return, this pension liabilities will put further pressure on such issuers and their fixed costs.
At this time, we do not think either type of these higher risk sectors are suitable for the mattress-money allocation of your net worth, nor is prudent given the current economic climate.
We continue to find value in smaller and medium-sized, ex-metropolitan credits that are too small to be owned by the aforementioned large mutual fund providers. And which are backed by or used for essential services.
Risk 2: Certain issuers and sectors remain in desperate condition and are reliant on atypical – and likely temporary – sources of revenue or financing. The recently signed COVID relief and funding bill allocates funds to Chicago Public Schools (CPS) and over $4 billion to New York City’s MTA, while the same agency has already maxed out its allowed financing from the Fed’s Municipal Lending Facility (MLF) and is projected to run significant deficits in the coming years. The State of Illinois has tapped the MLF as well, while the State of New Jersey strongly considered the facility before going to the public markets.
These sources of funding and financing are not a panacea for structurally imbalanced issuers nor comforting for debtholders knowing that one’s security is underpinned by extraordinary Federal intervention.
In the coming years, unless these types of issuers make significant reforms or budget/service cuts, which may be politically unpalatable at the local level, we fear a failure to obtain Federal dollars to bridge their funding gaps can cause not only a cash squeeze to those credits but also “headline risk” in the market generally, thereby unsettling prices.
The types of credits mentioned above are not illustrative of the market as a whole, and any market weakness resulting from their inability to secure extraordinary federal support should be looked at as a buying opportunity for your average credit.
We continue to find value in smaller and medium-sized, ex-metropolitan credits that are too small to be owned by the aforementioned large mutual fund providers. And which are backed by or used for essential services. These types of bonds are a great way to i) add spread (relatively higher yields) and ii) diversify holdings away from large mutual fund providers.
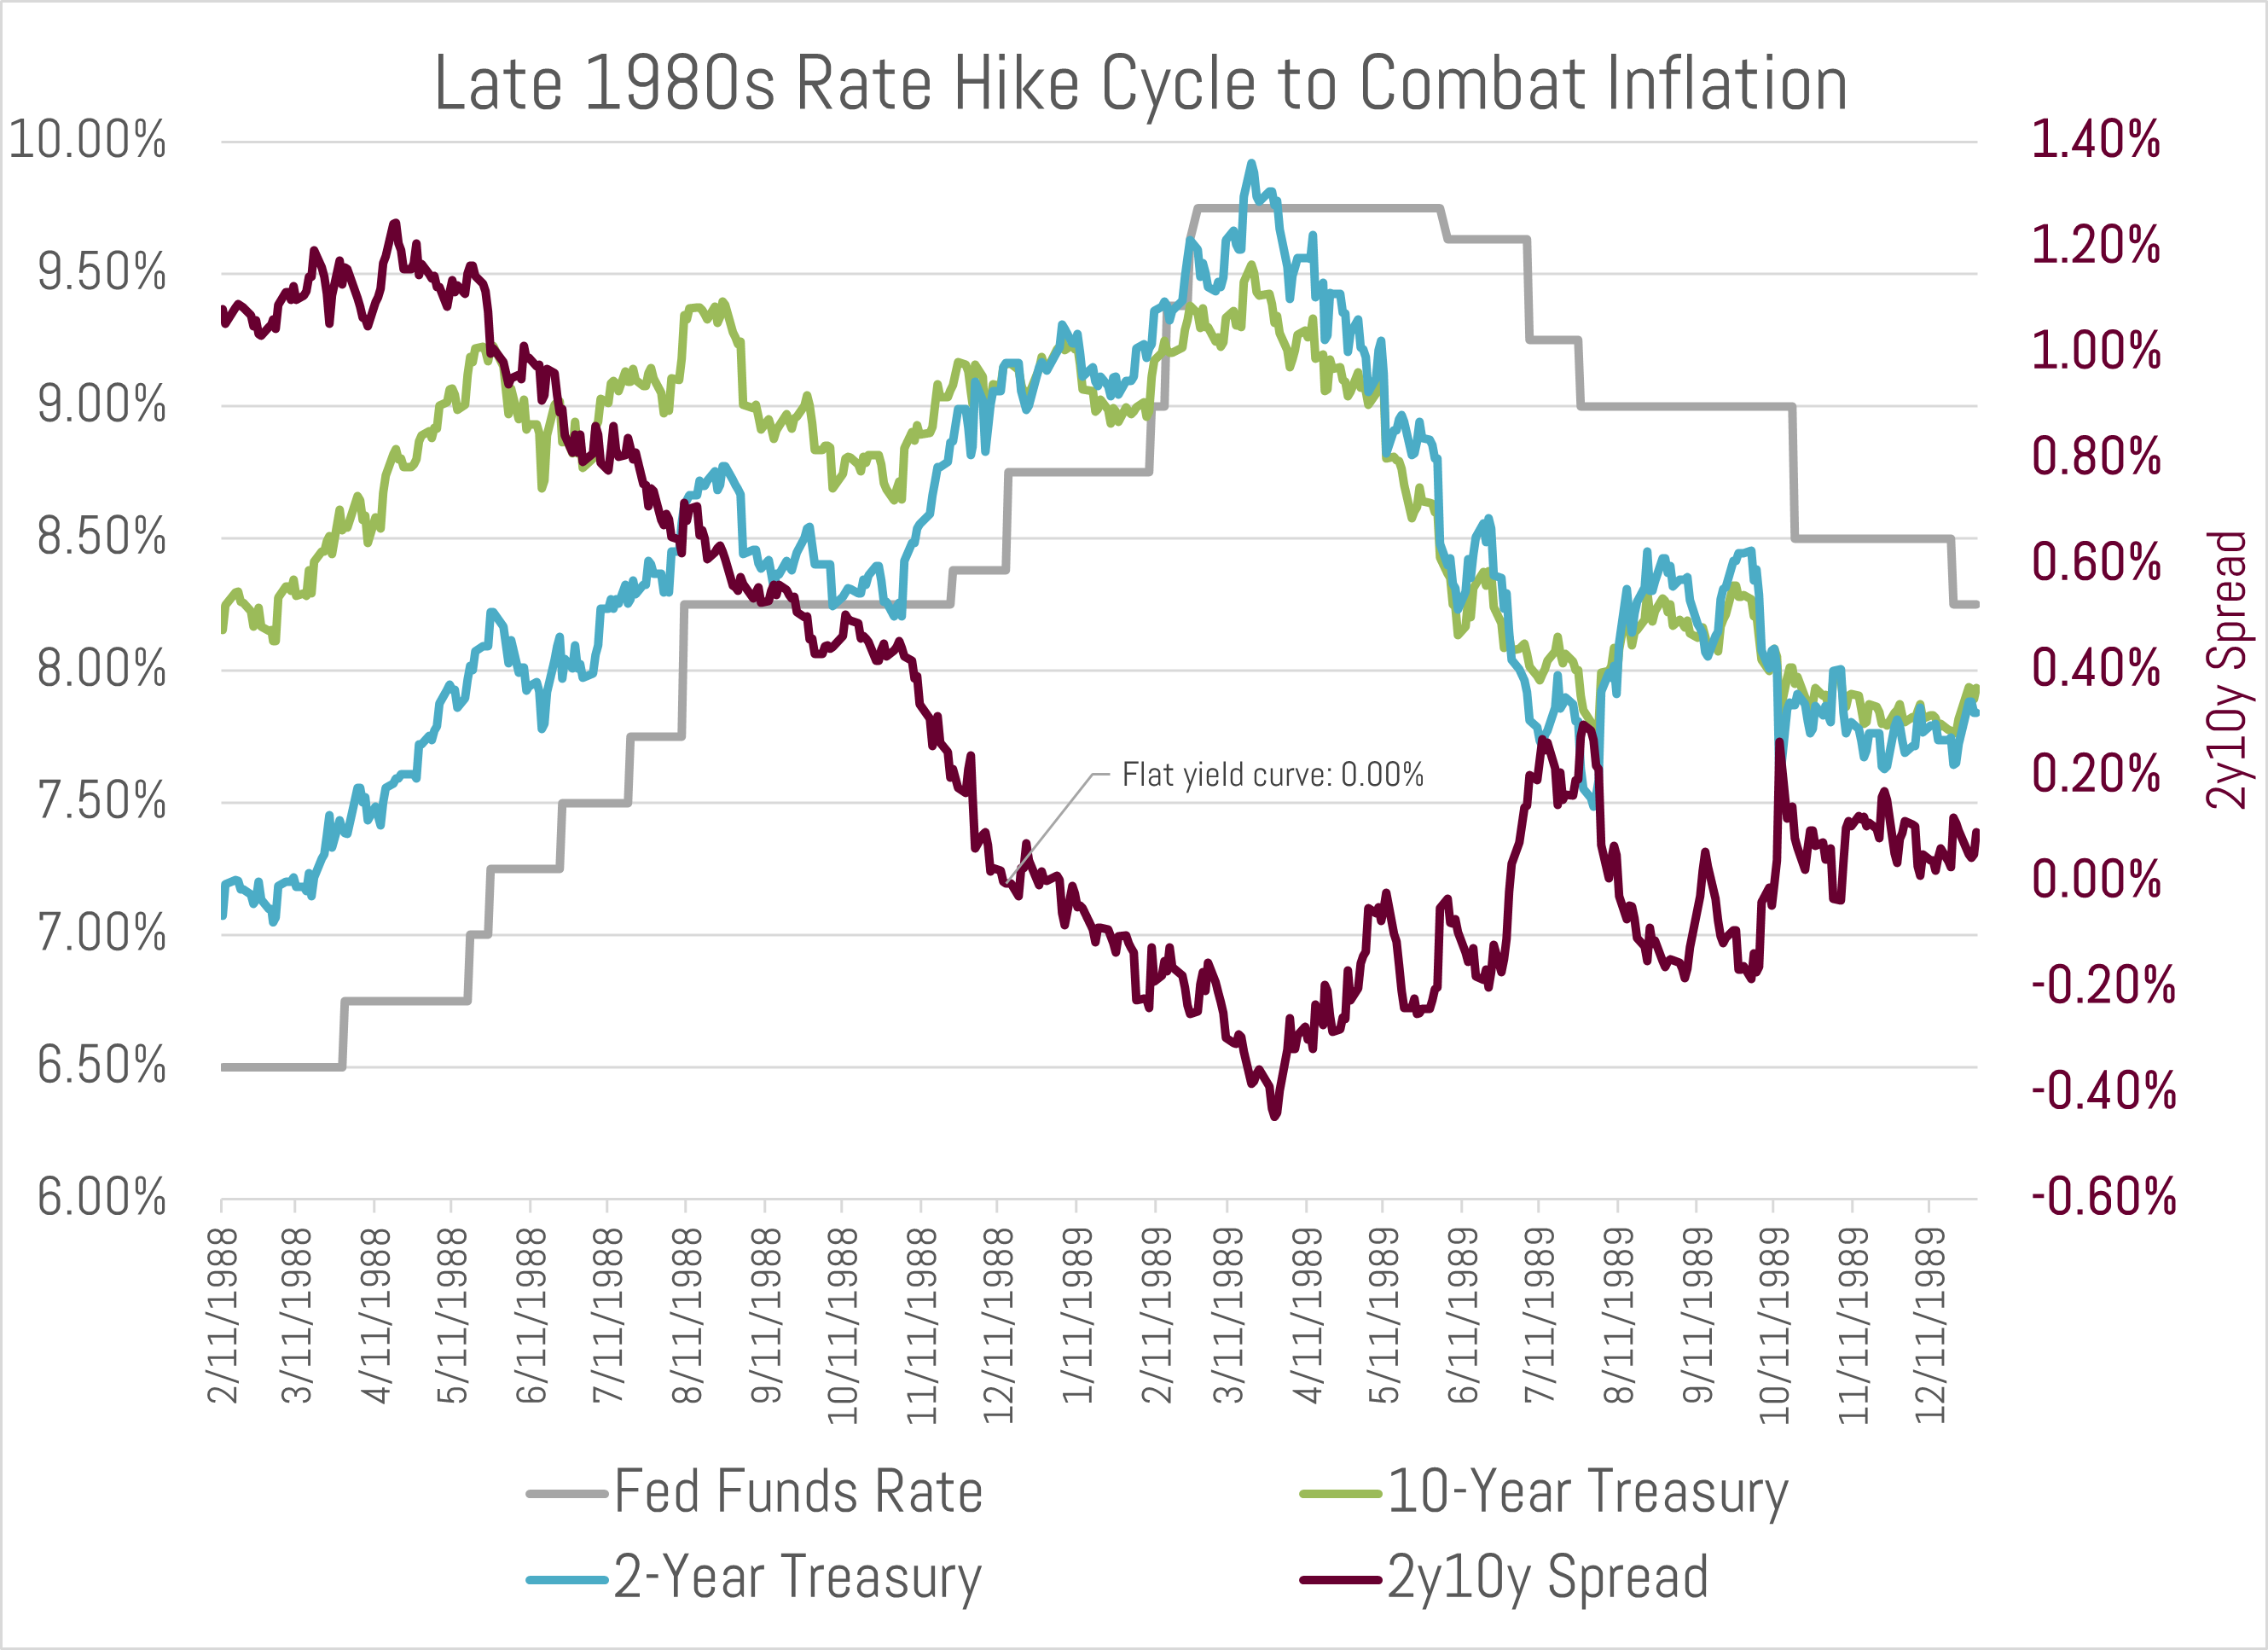
We think patience is warranted in 2021 as the economy heals and rates begin to normalize. Should the recovery move faster than the market or Fed anticipates and if inflations picks up, our traditional ladder strategy will be able to take advantage of the rate reset. That said, we do not think it is appropriate in this environment to reach for yield by targeting low-grade, lower credit issuers.
Please call your Investment Specialist if you have any questions and would like to review portfolio holdings.
Sincerely,
Matt Bernardi
Vice President
January 5th, 2021
- Bernardi Securities Unapparent Risk in Municipal Bond Land, December 30th, 2019
- Source: Bloomberg “NAV” page
- Moody’s US Municipal Bond Defaults and Recoveries, 1970-2019
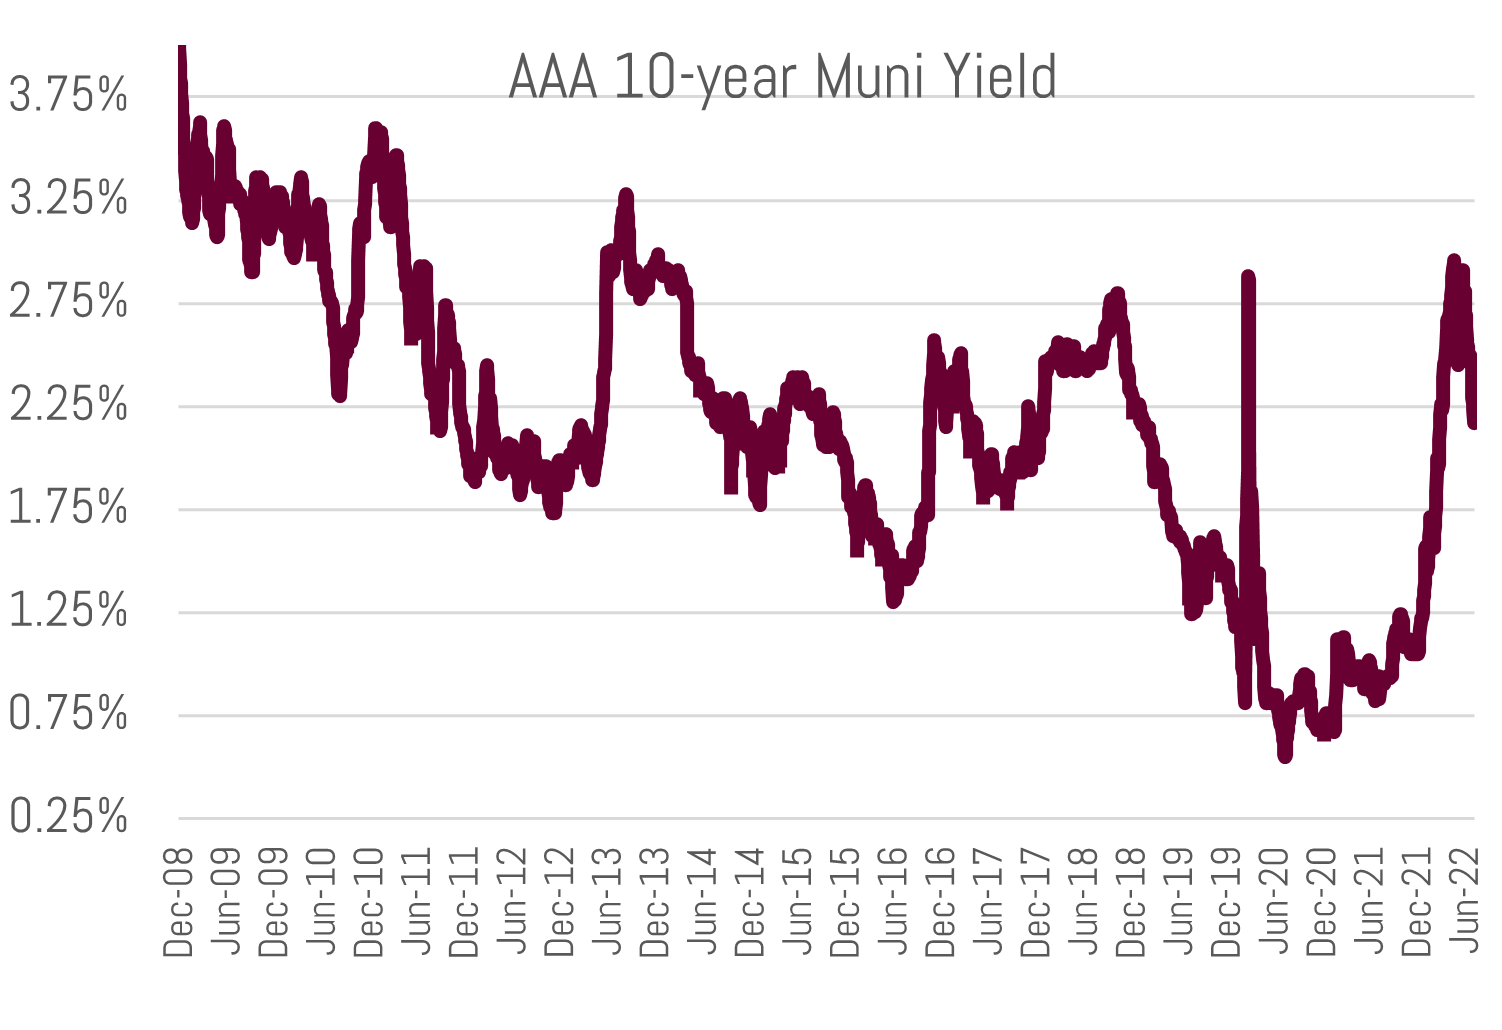


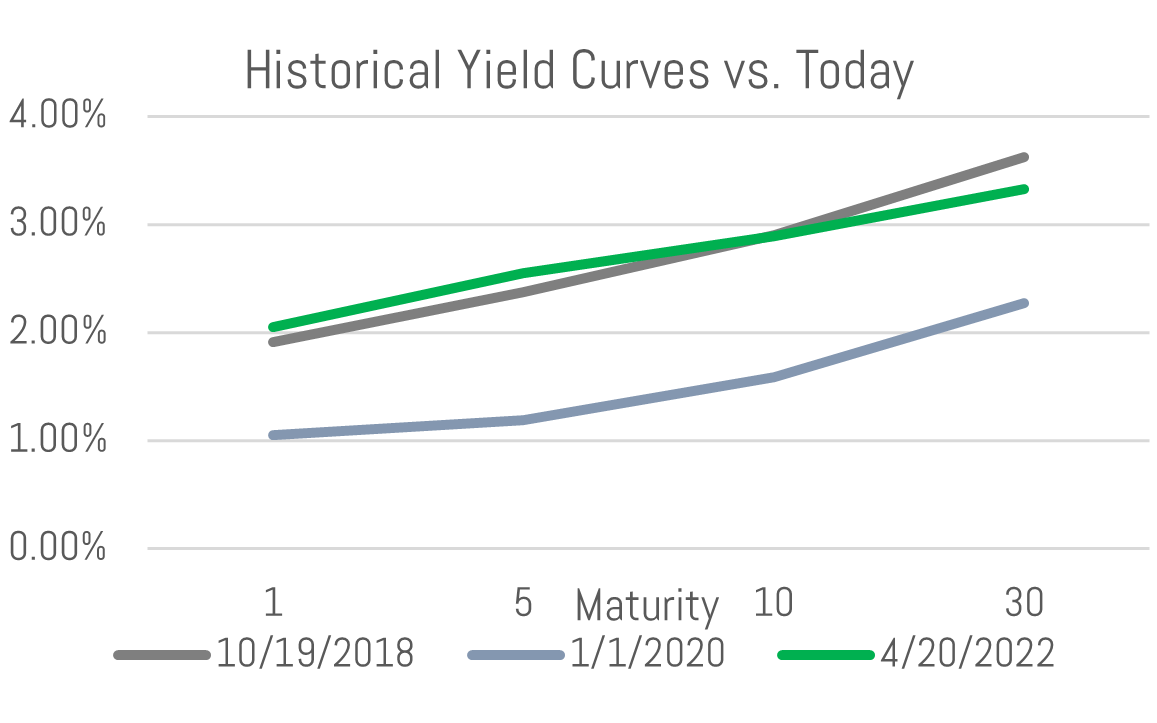
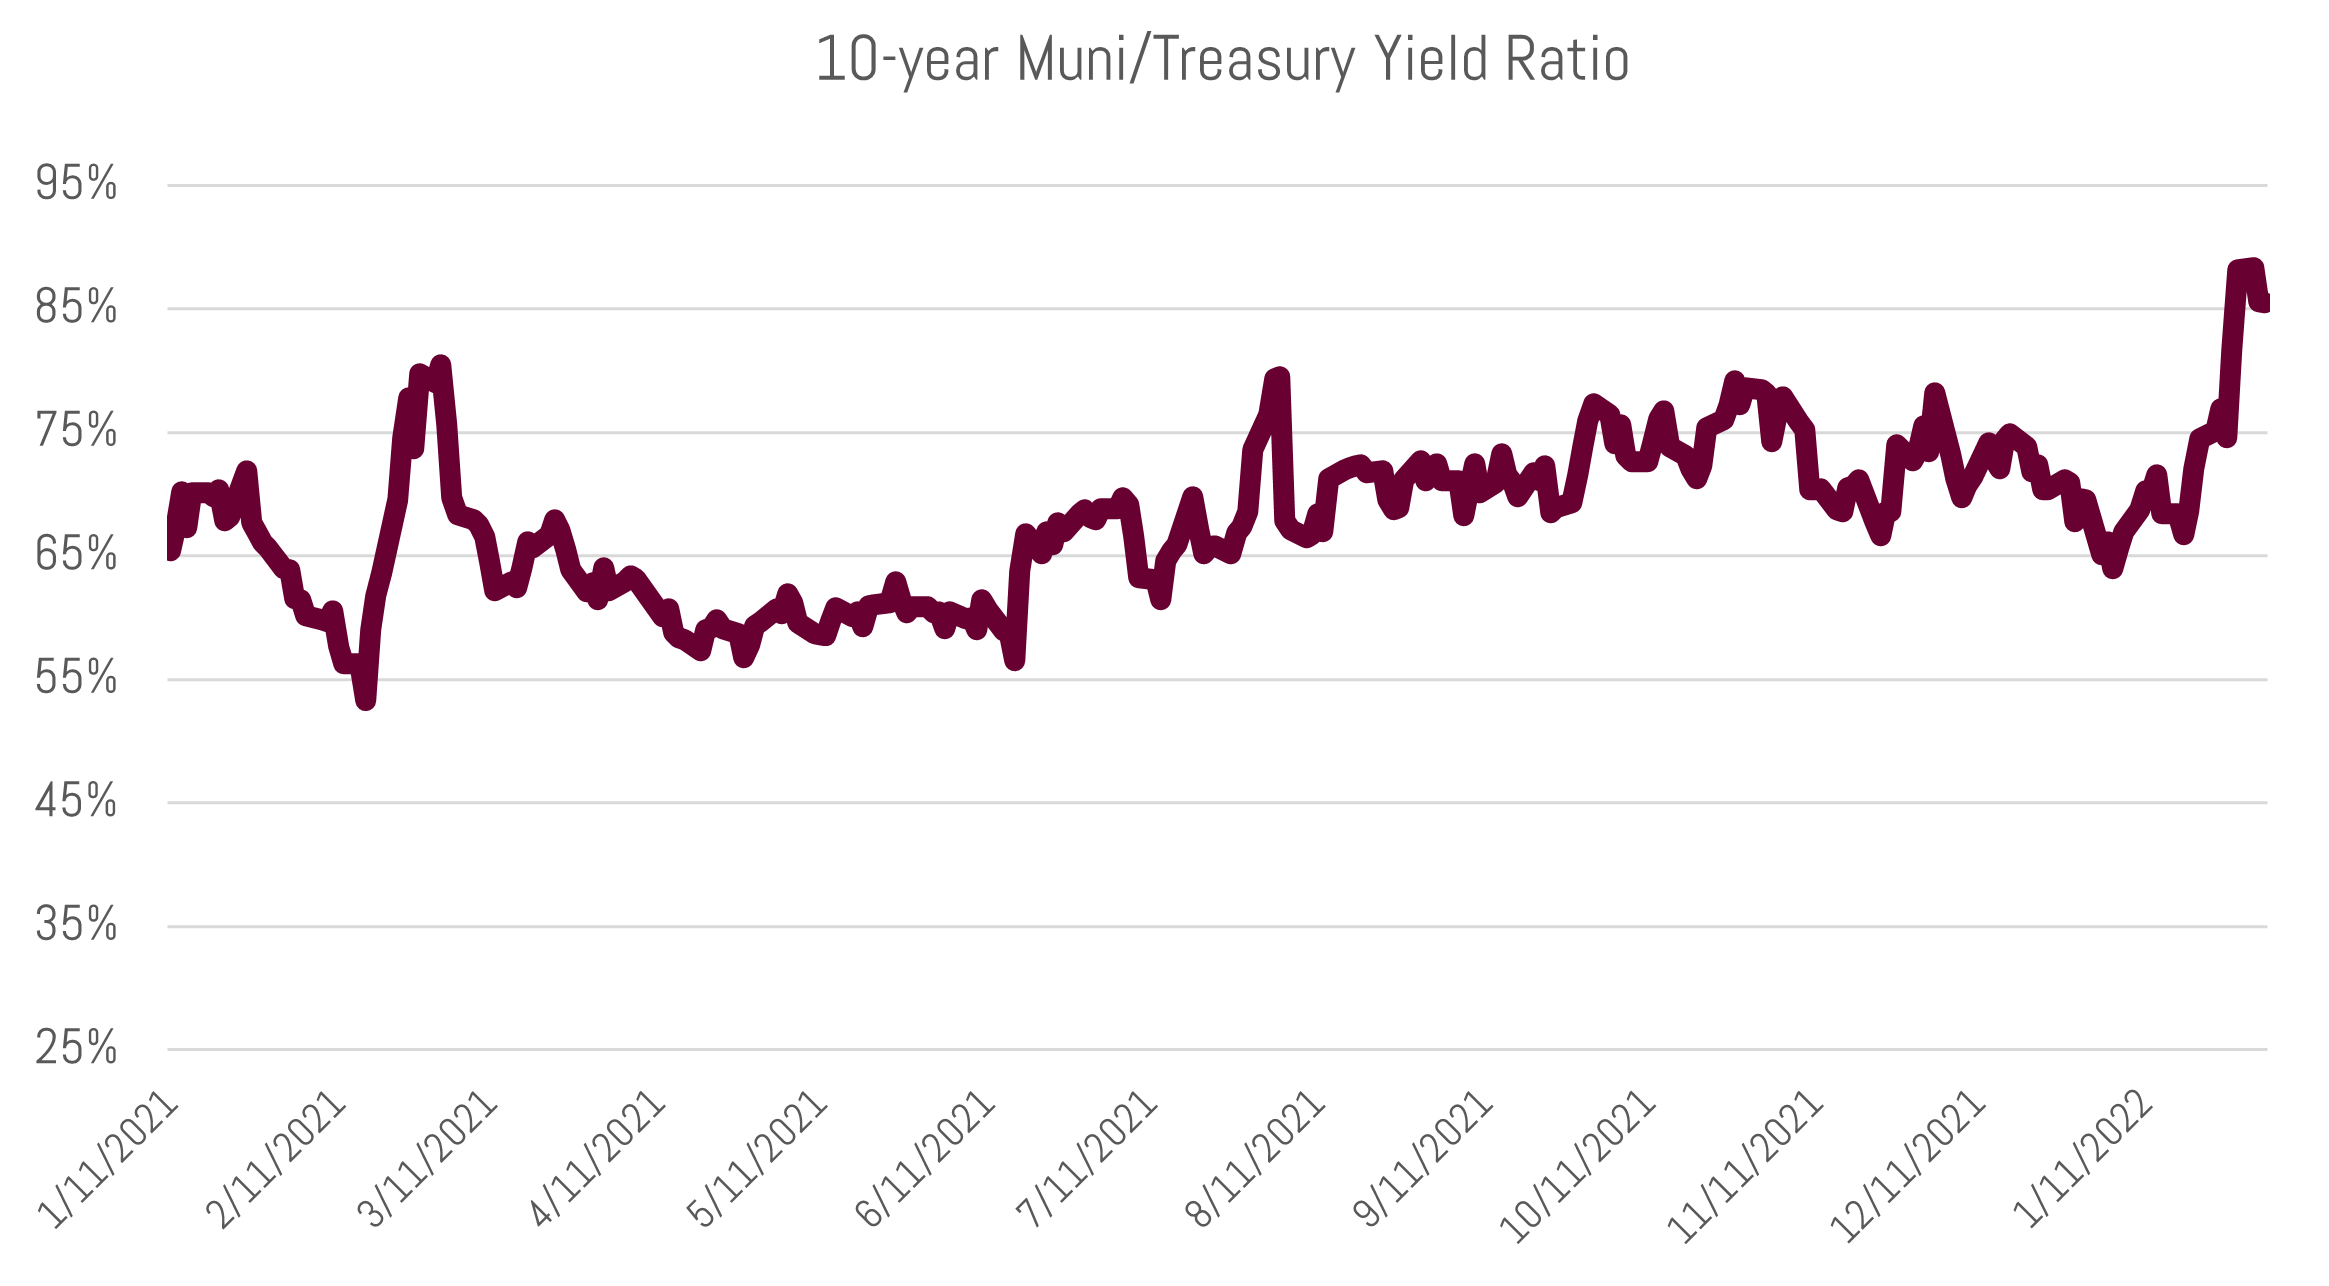
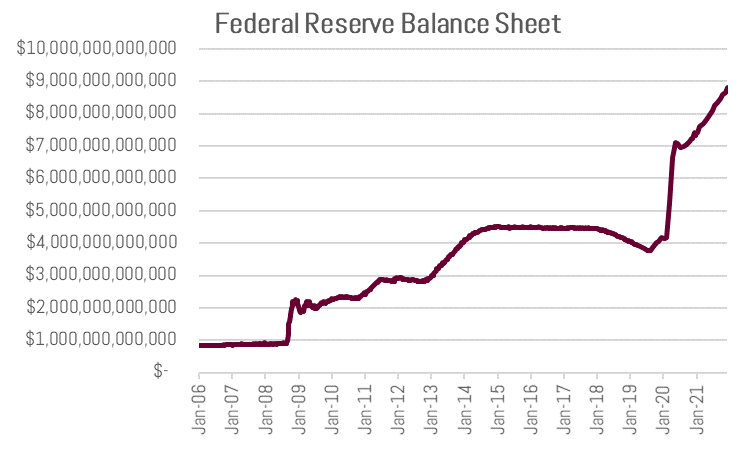
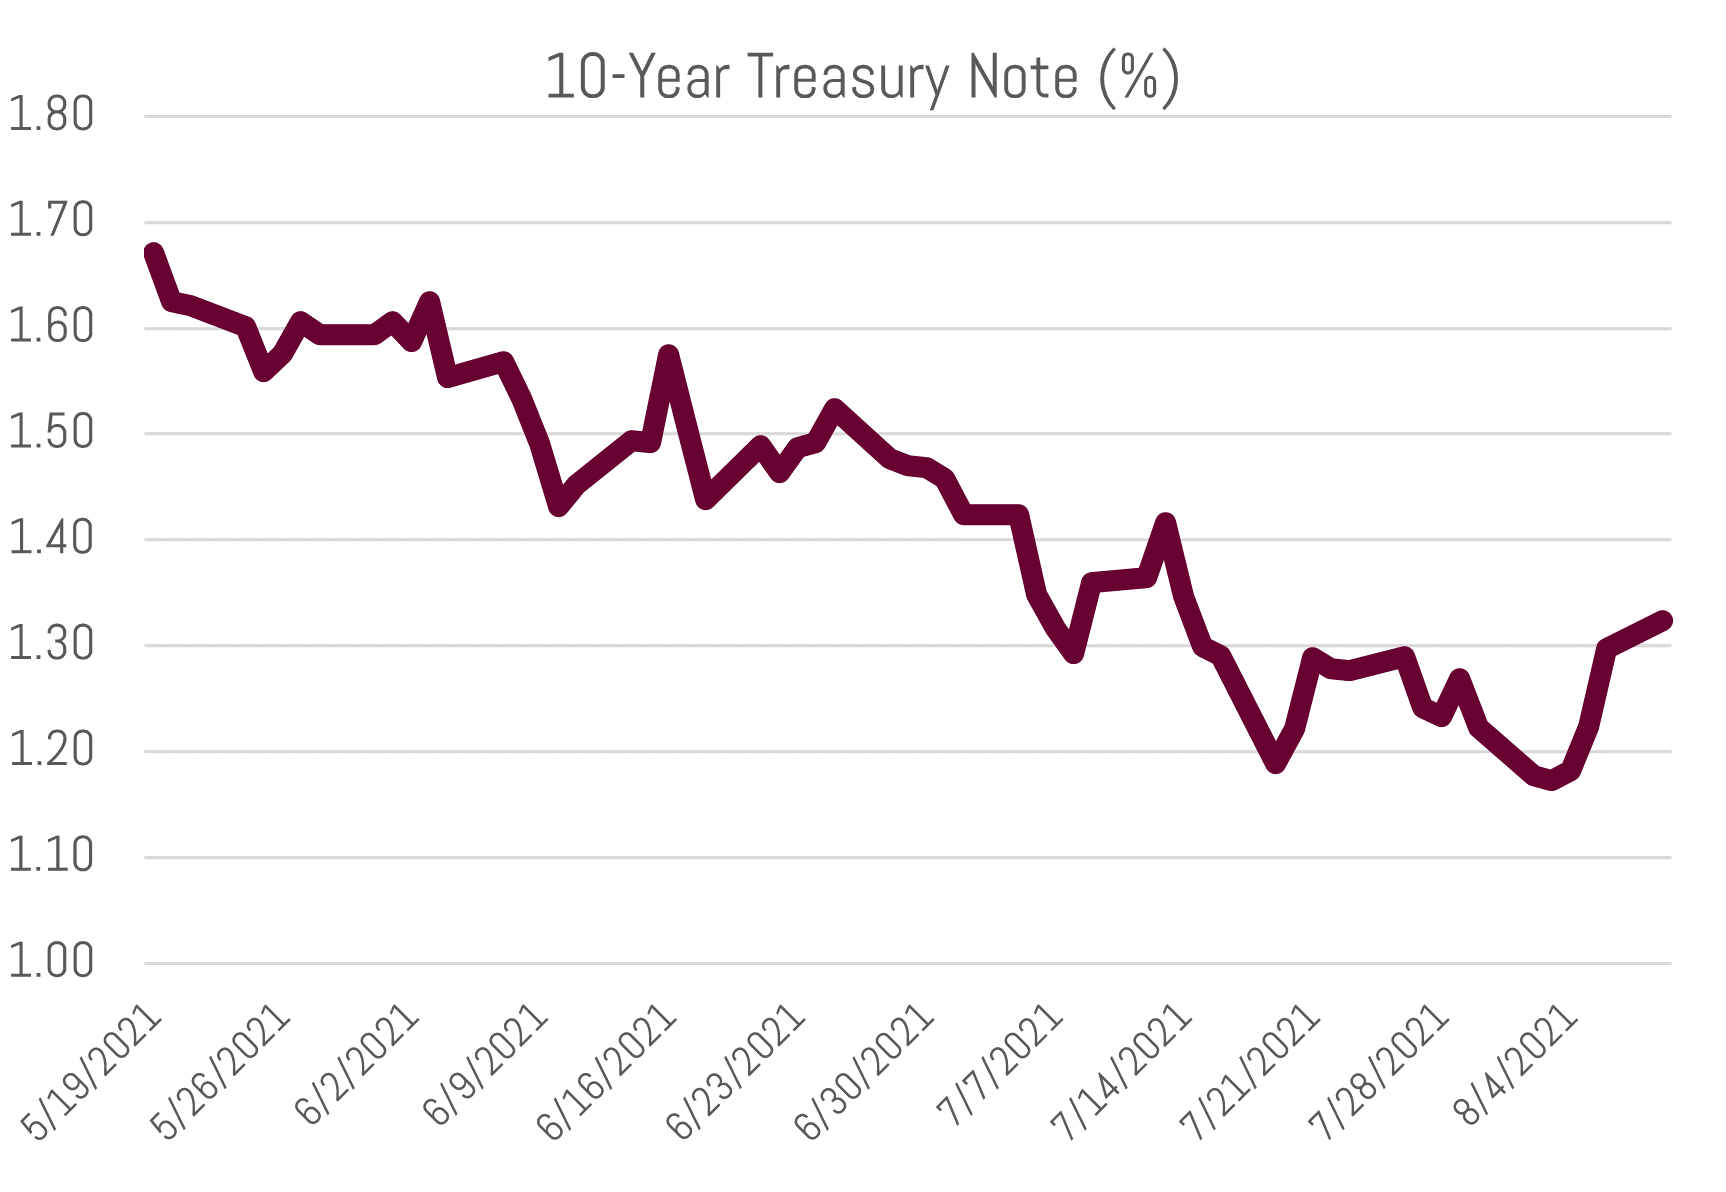
 Municipal yields – and bond yields in general – have stagnated since the early spring even though economic growth is robust and inflation readings are high. The market has largely looked through these metrics, as many believe this dynamic will be short-lived. What underpins this stance is the view that growth and inflation metrics are simply boosted by fleeting catalysts such as supply chain bottlenecks and one-time federal stimulus measures. The immense presence of the Fed’s growing balance sheet has served as further support for current market yields, as well.