Market Summary & Relative Value of (Municipal) Bonds
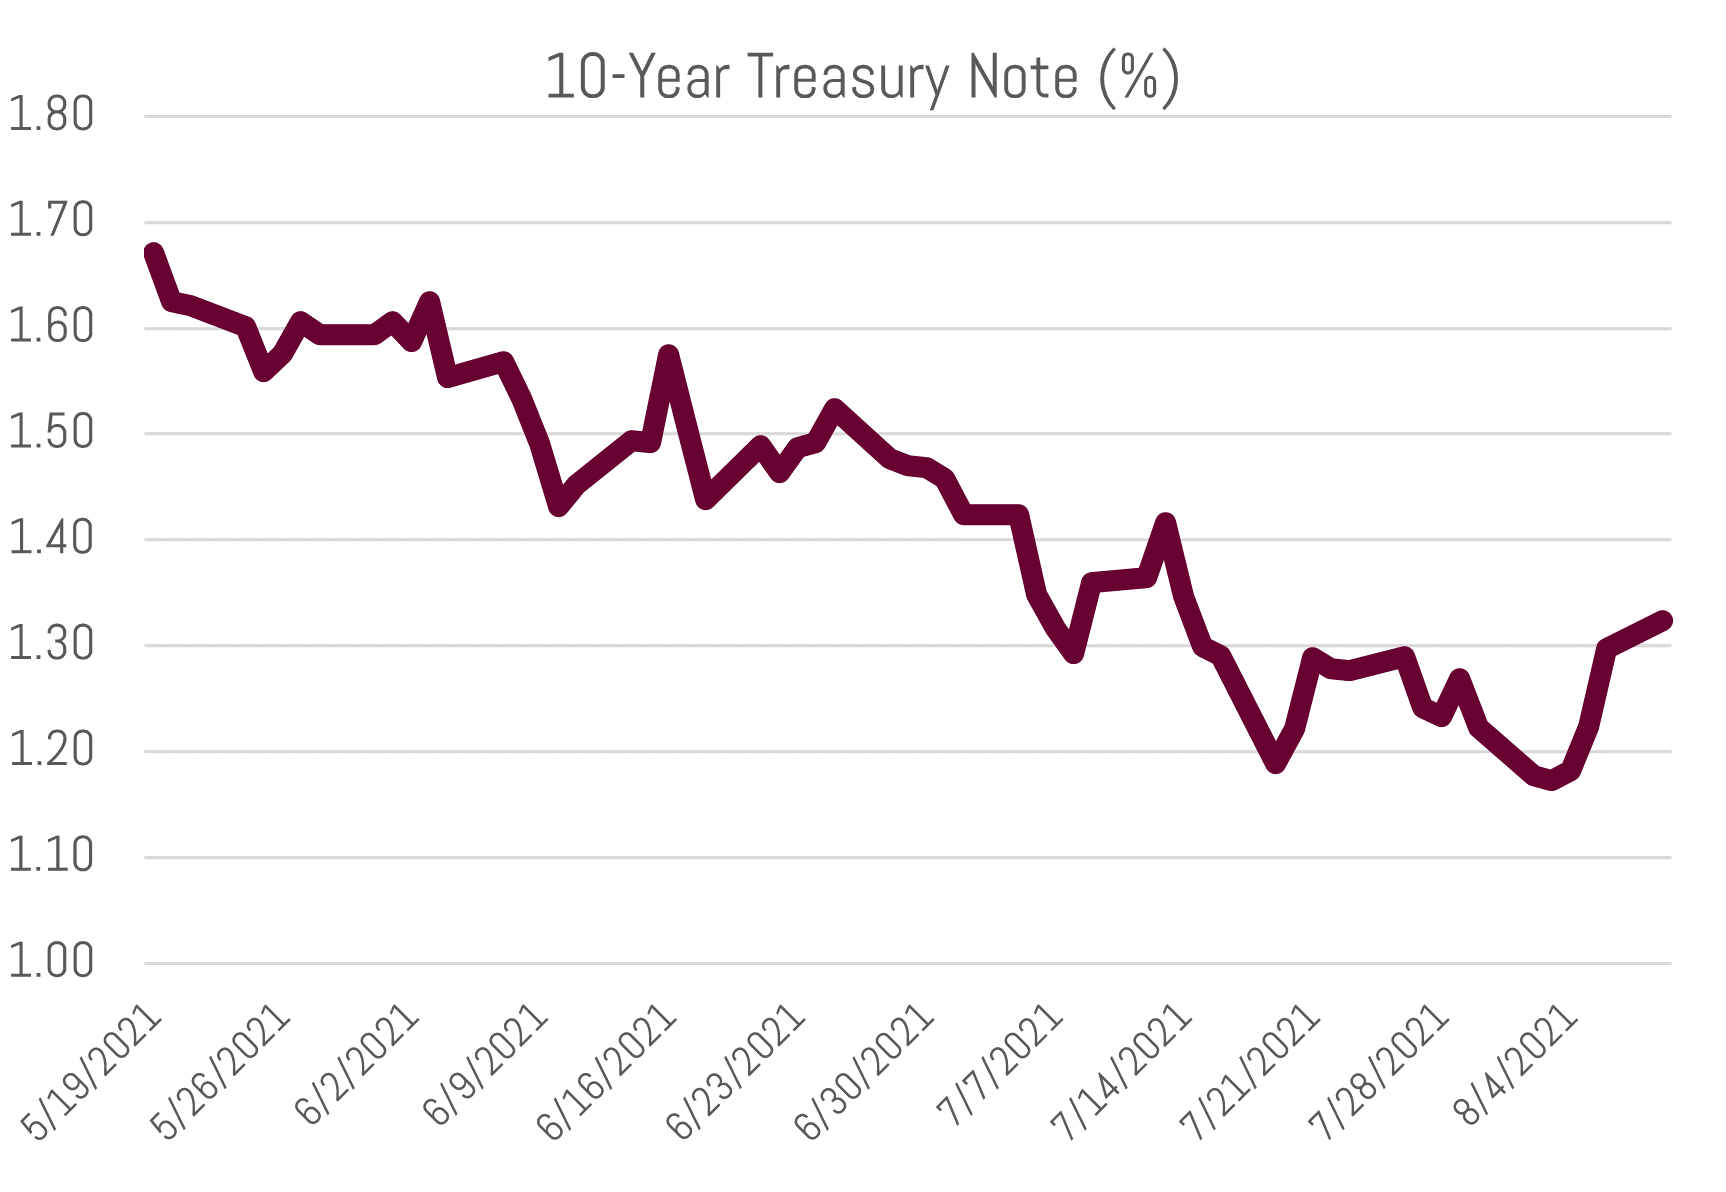
The two main ingredients determining long-term bonds yields are future growth and inflation expectations. Yields have dropped significantly the past number of months as investors have come around to the Fed’s view of high inflation as transitory and the expectation of muted long-term growth projections.
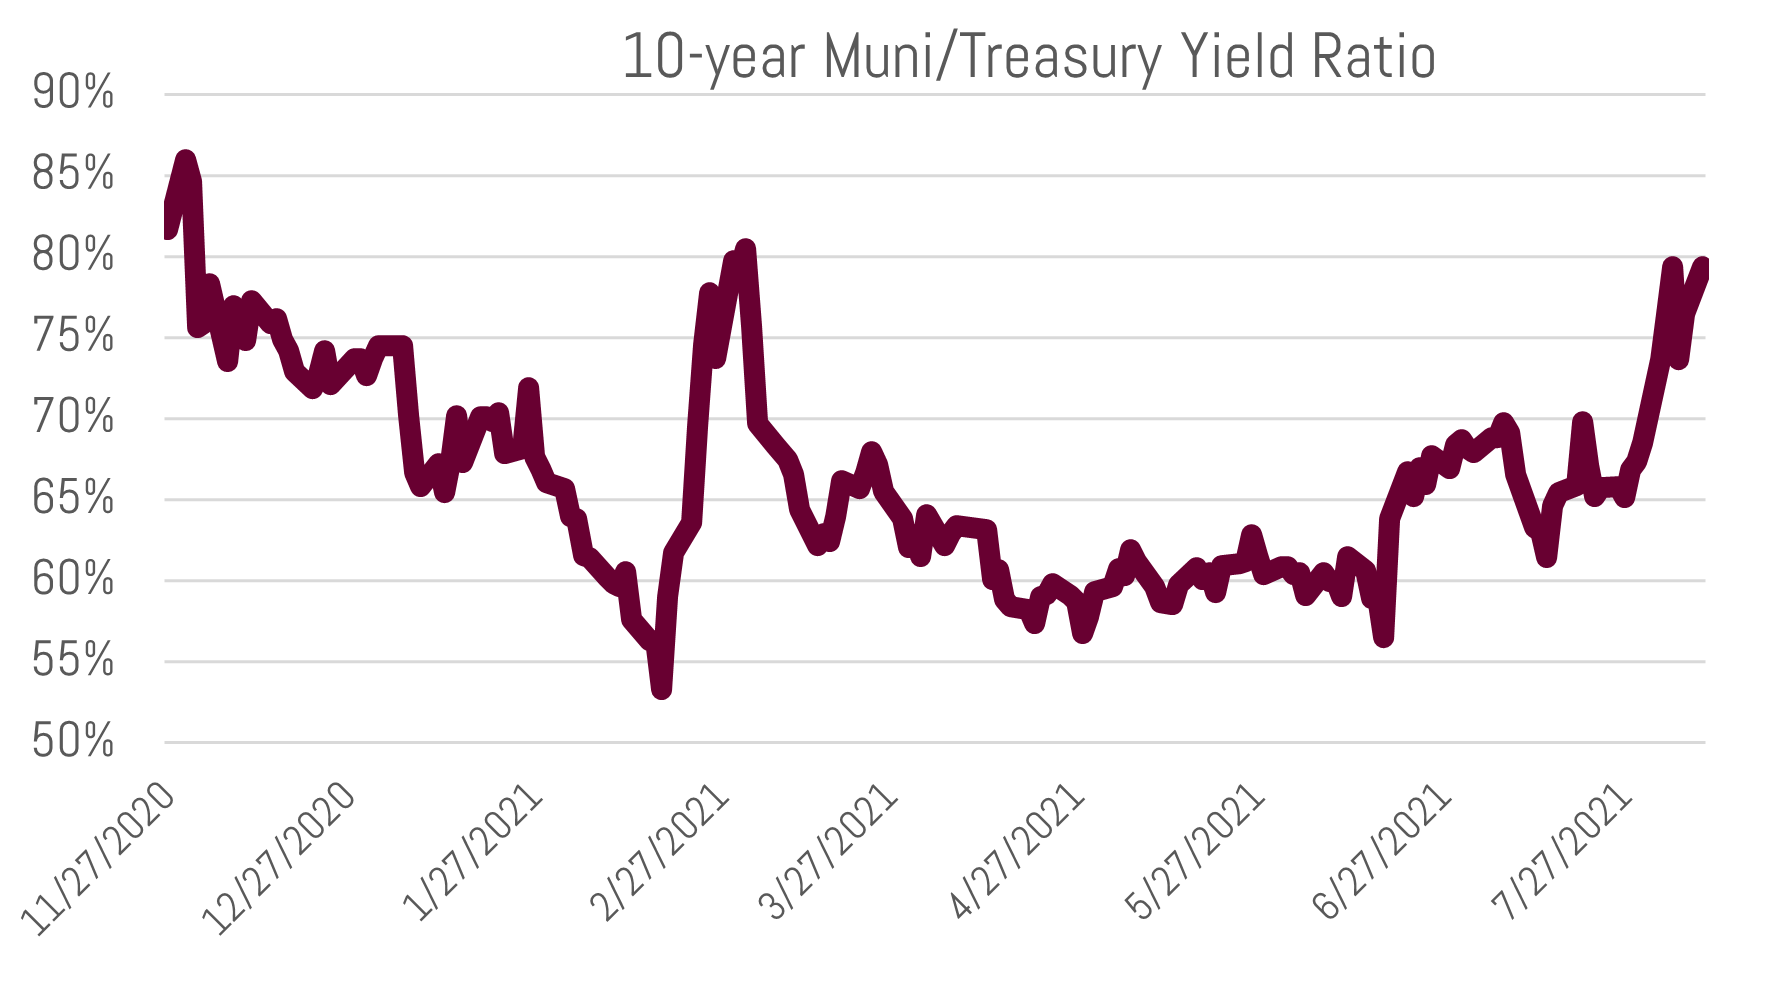
Over the past four months, the 10-year Treasury Note has moved from over 1.70% to under 1.35%. Average yields for 10-year AA rated municipals are 0.99% (taxable equivalent at the 37% bracket is 1.57%). The tax-exempt yield is roughly 75% of treasuries, which is a reasonable valuation relative to historical levels, current market fundamentals, and the potential for higher tax rates.
It is impossible to know if the market’s and Fed’s subdued view on growth and inflation will ultimately be correct. In terms of growth potential, debt (high) and demographics (older and low fertility rates) are major weights on the economy and support the view that long term growth will remain low relative to past experience. This view is corroborated by Japan’s experience and has played out in its domestic financial markets in two ways:
1. Low Yields: Japan’s 10-year treasury is 0.019% (nearly zero)
Click to zoom in on the graphic below. Reference the “Yld” column for Japan under Asia/Pacific. As you will see, negative yields are present in many European countries’ 10-year debt, as well.

Source: Bloomberg
2. Poor stock market returns: Since the Japanese economy peaked in the 1980s their benchmark stock index (Nikkei) is still well below all-time highs.
Source: Bloomberg
Today’s high levels of fiscal and monetary policy stimulus, and low yields are supportive of high valuations for asset classes across the board, including real estate and the stock market. If you click the link, you’ll notice the Shiller PE Ratio is nearing an all-time high. This ratio was created by Yale economist Robert Shiller and graphs the price to earnings ratio based on average inflation-adjusted earnings from the previous 10 years.
Stocks currently benefit from low yields as:
- Corporations can fund debt at low levels
- They enhance relative valuations as: i.) the S&P dividend ratio seems attractive relative to bonds, thereby boosting stock prices and ii.) the P/E multiple of stocks can move higher as P/E ratio of bonds moves higher (price/yield)
- Discounted cash flow models (a way to value stocks) price the current value of stocks higher when the discount rate (yield) is lower
As the Fed continues to push the pedal to the metal with easy money, this rising tide is lifting all boats (prices).
There are three potential pathways forward in terms of yields:
1. Should we move into a Japan-like scenario, bond prices will continue to benefit (stocks probably not so much). Disinflationary/deflationary economies are good for bond prices (and vice versa).
2. Should the market (and Fed) be wrong, and inflation is here to stay, we believe our laddered portfolios can weather the storm and, over time, take advantage of gradually increasing yields.
The inflationary environment of the late 1970s to mid-80’s took nearly 10-years for the cycle to play out. This is ample time for a laddered portfolio to naturally reorient itself at higher rate levels due to principal/coupon reinvestments.
That said – in all likelihood – the Fed learned its Volker-taught lesson of this time period. Therefore, it would not allow high levels of inflation to persist for such a long time and would quickly stamp this out through monetary tightening policies.
Source: Bloomberg
3. We stay at current levels:
Currently, municipal valuations are relatively attractive to other high-grade fixed income asset classes.
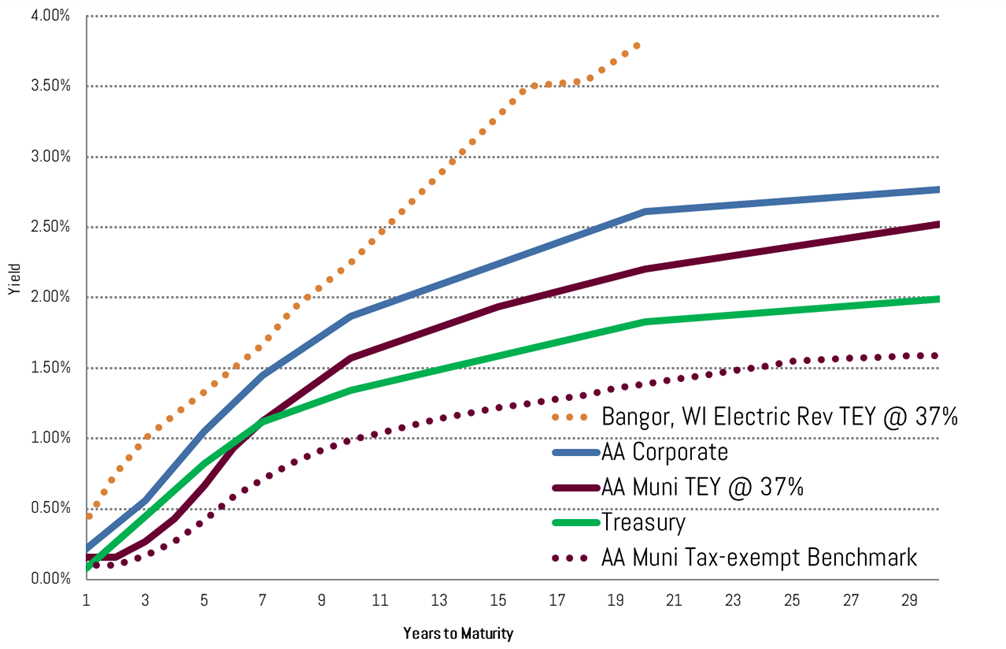
Below is a yield curve comparison depicting yields (from highest to lowest) for:
- Taxable equivalent yield (37%) of a recent tax-exempt Bangor, WI Electric Utility Revenue issue: This is for example only and demonstrates the types of bonds we invest in for our clients.
- AA rated Corporate Benchmark (Bloomberg)
- Taxable equivalent yield (37%) of the tax-exempt municipal benchmark (MMD)
- Treasury yields
- (Dotted) Tax-exempt municipal AA rated benchmark (MMD)
Munis remain attractive in yield and credit quality. A recent Moody’s Default Report[1] noted that:
- There were no virus-related municipal bond defaults in 2020
- Municipal ratings were resilient to virus-related pressures…while corporate ratings experienced more frequent rating downgrades
- Municipal credits continue to remain highly rated
Diversification is key in this environment. Both in terms of asset classes and one’s bond portfolio maturity range. And relatively speaking, municipals remain a very attractive high-grade fixed income asset class when considering both yield and safety.
Relative to other asset classes, bonds will provide a safe-haven in a low inflation/deflationary environment and should not experience the same levels of volatility as stocks during uncertain/bad economic climates. Yields are low given the Fed’s activity in the market, though as I noted above, all asset classes are artificially stimulated given this activity.
If you have any questions regarding your portfolio or the market in general, don’t hesitate to reach out to your Investment Specialist or Portfolio Manager.
Sincerely,
Matt Bernardi
Vice President
[1] Moody’s Investors Service: US municipal bond defaults and recoveries, 1970-2020; July 9th, 2021