Market Update: Municipal Yield and Valuation Overview
The first half of 2022 is one of the few market environments in recent history where all major asset classes suffered. The Novel Investor blog’s Asset Class Returns captures this nicely noting “cash” outperformed with a +0.2% return. “HG Bonds” (high-grade bonds) came in an uninspiring second place at negative 10.4%, while the S&P 500 was down 20.57% through this period. Returns have improved since this data was posted as stocks have rallied and bond yields have generally decreased, thereby increasing prices. However, the economy is giving us mixed messages about its underlying health, while inflation pressures persist. The latter causes the Federal Reserve to remain aggressive in its tightening policies by increasing short term rates and further reducing its almost $9 trillion balance sheet. Overall, this creates a very complicated investing environment and a highly uncertain future.
Municipals have not been immune from this volatility, but they have relatively outperformed.[1] Interest rates have increased drastically since the end of 2021 as the Fed turned a 180 after being caught on its backfoot with high inflation. Given the bond market’s sell-off earlier in the year, we are able to invest in a market that offers:
-
- High tax-exempt rates vs. recent history
- High tax-exempt rates vs. alternative high-grade fixed income
In terms of historical yields: The average AA rated 10-year municipal yields roughly 2.50% tax-exempt[2], which is equivalent to investing in a 3.96% taxable bond at the 37% bracket. This rate topped out at 3% in mid-May, which was a 10-year high. We are still capturing 3% from time-to-time in this portion of the yield curve.
The future path of rates from here, as noted above, is highly uncertain. The recent decrease in yields is a function of an economy that is showing signs of weakness and other forward looking metrics that point to a slowdown, such as a slowing rate of money supply growth.
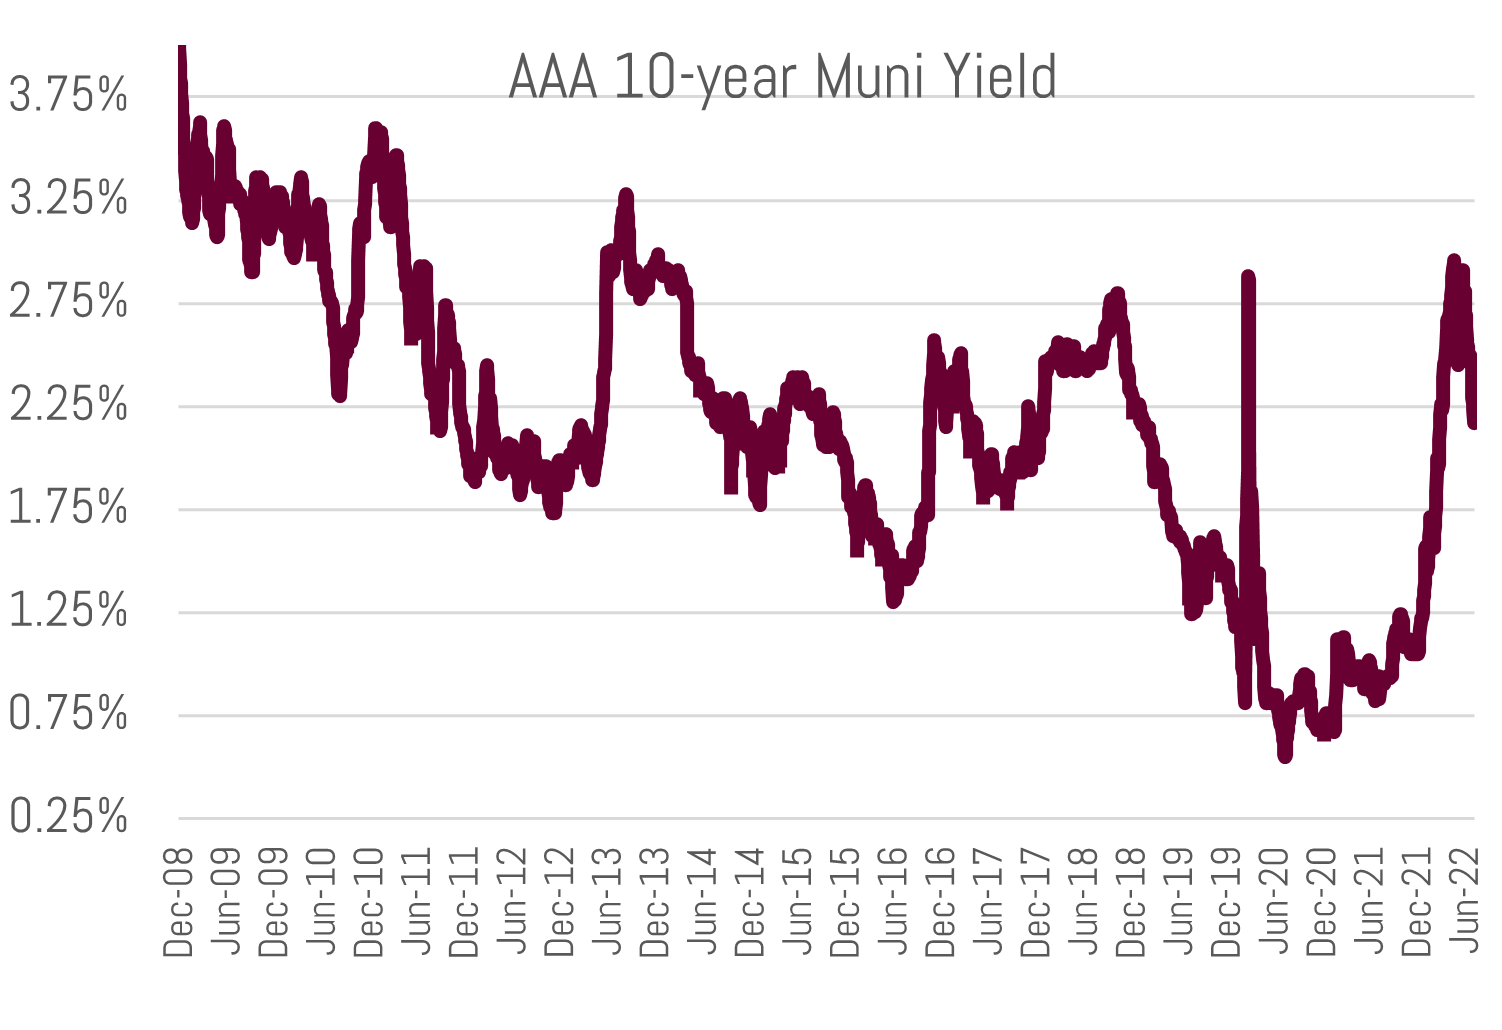
Source: Bloomberg
From a relative valuation and return perspective: due to their tax-exempt nature, taxable equivalent yields[3] for municipals are attractive for a majority of the yield curve compared to treasury and corporate bonds as depicted by the chart below. Municipals benefit from their yield curve structure, which remains positively sloped. Unlike the treasury curve which has a negative 2y10y ratio (i.e. inverted) as the 2-year treasury currently yields 3.25% vs. 2.79% for the 10-year. This spread of negative 0.46% is the lowest since the early 1980s. Every recession the past 60 years has been preceded by an inverted yield curve.

Source: Bloomberg
Moody’s recently noted that “strong fiscal governance positions States to withstand high inflation, possible recession.”[4] This confirms our stance that your average state and municipality is well positioned to address continued economic deterioration. Generally, corporate bonds do not offer the same level of principal preservation due to more economically sensitive underlying sources of revenue. This leads to higher credit volatility and historical default rates. AAA and AA rated municipal yields have 60-year historical default rates of 0% and 0.02%, respectively.[5] The relative default risk of high-grade municipals versus treasury bonds is de minimus, as well. Of course, theoretically in a worst-case scenario, the U.S. Treasury could always print more money to pay bondholders. This is an instrument of governance municipalities do not have.
Source: Bloomberg
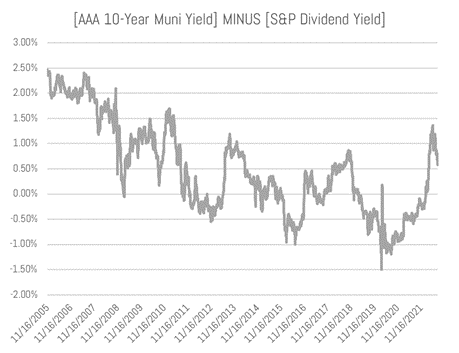
Another indication that municipal yields are attractive, is the difference between the AAA rated 10-year municipal yield and the S&P 500 dividend yield recently reached a level (1.20%) not seen since the Great Financial Crisis in 2009. According to Bloomberg, the 10-year AAA municipal yields 2.21%, while the S&P 500’s estimated dividend yield is 1.57%. The difference of 0.64% is above the 10-year average of negative 0.03%.
This yield difference is still lower than pre-financial crisis[6], but we would not expect this relationship to return any time soon. At the current pace of asset sales, it would take the Federal Reserve over 10-years to unravel the Quantitative Easing purchases since 2008.
This is certainly a paradigm we’d welcome as it would provide higher yields and a market equilibrium driven by investors, rather than central bankers. Should we be in the initial innings of this, you should expect your laddered, separate account portfolios will average in over time at these higher rates. Then again, our economy has become extremely dependent on such policies so the undoing of them will be accompanied by uncertainty which begets bouts of economic weakness and volatility.
Regardless, investing is a relative game and today’s municipal yields offer great value in of themselves and relative to other asset classes. We believe this, paired with underlying credit sturdiness, sets up municipals very well for the balance of the year. Should the Fed induce additional economic weakness, municipal revenues will remain stable and default rates low, in line with historical averages.
If you have any questions or would like to discuss your portfolio in more detail, please contact your Investment Specialist or Portfolio Manager.
Sincerely,
Matt Bernardi
August 2022
[1] The Bloomberg Municipal Bond Index (LMBITR Index) was down 8.98% through 6/30/2022
[2] Source: MMD
[3] Taxable equivalent yield is calculated by taking the tax-exempt yield and divide by (1 minus tax rate percentage)
[4] Moody’s Investors Service, Sector In-Depth: “Strong fiscal governance positions states to withstand high inflation, possible recession” August 8th, 2022
[5] Source: Moody’s
[6] On January 1st, 2008 the AAA muni yielded 3.74% while the S&P 500 dividend yield was 2.02% leading to a difference of 1.72%