Municipal Market Update – Bonds are Back!
Jerome Powell and his Federal Reserve colleagues have begun taking steps to put the income back in fixed income assets, leading to one of the worst bond market drawdowns in the past forty years. Rates have spiked as the Fed has made a rapid about-face in its monetary policy approach, as it aims to quell inflation, potentially at the expense of slowing the economy.
Concurrently, municipal yields are up substantially and offer attractive yields when compared to alternative high-grade fixed income assets. Should the new Fed policy induce a recession, current yield levels of municipals offer significant value in our view – and credit protection, since solid quality credits can weather a soft economy with high cash balances, non-discretionary sources of revenue, and myriad expense cutting capabilities.
Our separately managed account (SMA) portfolios have held up relatively well in this environment – especially versus fund alternatives – and are poised to take advantage of higher yields as our laddered portfolios progress forward.
An important aspect of the SMA structure is that losses remain on paper and can be selectively realized should a portfolio have tax loss needs.[1] Alternatively, a fund may have to forcibly realize losses as outside investors sell. This is a phenomenon that exacerbates declining valuations in the current market environment characterized by significant bond fund outflows.
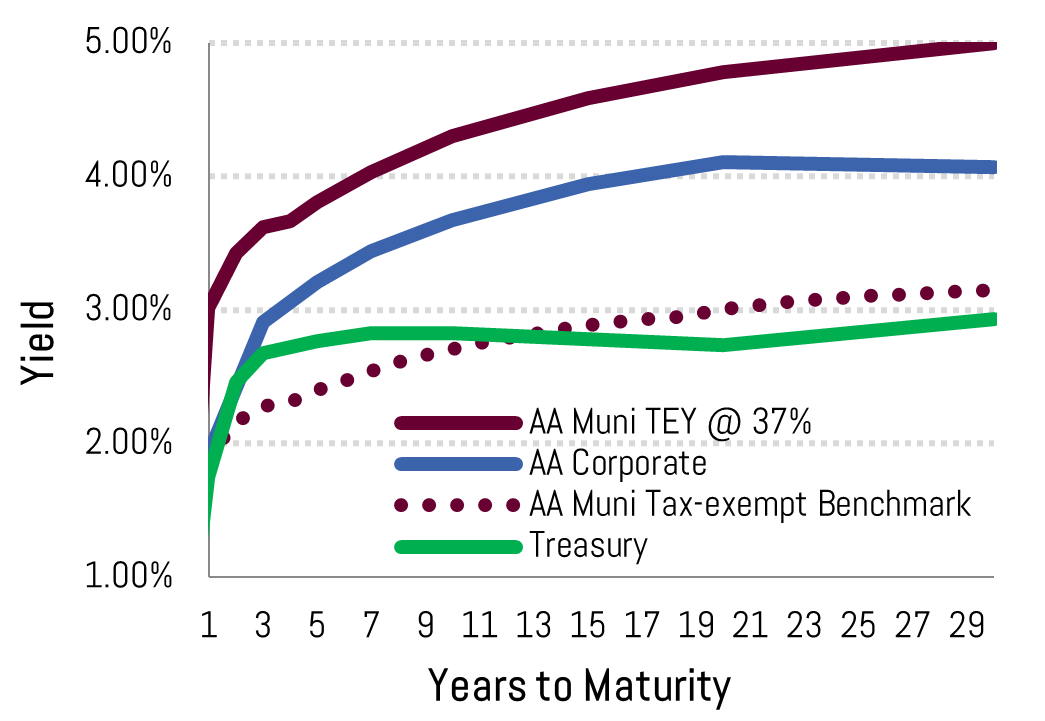
Today’s average AA rated 10-year municipal yields 2.89% vs. 1.15% at the start of the year. The 10-year treasury (which is taxable) yields 2 basis points less at the time of this writing. If you are in the top four tax brackets (24%, 32%, 35%, 37%) buying the average AA rated muni is like buying a 3.80-4.58% taxable bond. There is similar value across the entire yield curve, and we are seeking yields 20-40 basis points (0.20-0.40%) higher in the types of issuers we target.
Potentially you can add incrementally more value the longer out you invest due to a steep muni curve and flat-to-inverted treasury yield curve.[2] Please note, longer term bonds carry additional risk including higher levels of volatility and increased credit risk.
How We Got Here in Such Short Order
The spike higher in rates we have experienced this year is due to the Fed pulling a 180 degree turn in its approach to monetary policy. Just over a year ago, the Fed was projecting no interest rate increases until 2024.[3]
The Fed is now projecting and communicating:
- An aggressive rate hiking cycle for the next 8 months (see red dotted line on chart below): The market is pricing 9 more hikes through year-end, leading to a 2.50% FFR
- A departure from the traditional 25 basis point (0.25%) rate hike increments: There is a high likelihood the Fed will raise rates by 50 basis points (0.50%) at each of the next two meetings (May 4th and June 15th).
- A rapid decrease of the balance sheet, composed of $9 trillion of treasury bonds and mortgage-backed securities: The balance sheet has more than doubled from pre-COVID levels and they aim to sell upwards of $95 billion per month starting in May. A “normalized” balance sheet is in the $5.5-6 trillion range according to Ben Bernanke
We hope today’s yields stick and we are not in store for a 2018 repeat when the economy slowed before the Fed Funds Rate peaked at 2.50%. The chart below shows that the ISM Manufacturing Index[4] started deteriorating in the summer of 2018, shortly before the culmination of the hiking cycle in December 2018.

Figure 1 Source: Bloomberg
The projected path of the Fed Funds Rate through the end of this year matches the level reached in 2018. However, we are expected to get there at a much quicker pace.
We believe the laddered maturity structure, within a separate account is the best way to adapt to these volatile markets. We do not aim to predict if a repeat of 2018 or a 1994 “soft landing” is in store and believe the ladder can “average in” across either type of business cycle.
According to our Sharpe Ratio Analysis – which measures risk-adjusted returns – our Tactical Ladder and the High Income strategies have outperformed the benchmarks as of late.
| Bernardi Asset Management Composites vs. Benchmarks | |||
| As of 3/31/2022 | 3-Year Sharpe | Standard Dev. | Mod Duration |
| BAM Tactical Muni | 0.15 | 2.95 | 3.99 |
| Index: BBG Short/Int Muni | 0.13 | 3.17 | 3.43 |
| BAM High Income Muni | 0.33 | 3.46 | 4.25 |
| Index: BBG 15Yr Muni | 0.25 | 5.71 | 5.86 |
The higher the Sharpe Ratio the better. It demonstrates either higher returns and/or a low standard deviation (level of volatility). For your municipal allocation, these two outputs are vital as you want to both outperform the benchmark and preserve your wealth when the market goes against you, as it has the past quarter.
We attribute our attractive Sharpe Ratios and returns to a number of factors, including:
i.) Ladder Maturity Structure: this enables ongoing cash flows to reinvest at higher rates. It prevents portfolios from speculating on timing rates and when the next business cycle will turn. It also keeps portfolio turnover low compared to the “barbell” strategy.
ii.) Small-to-medium-sized issuers: these types of bonds provide two benefits:
- Higher yields given their smaller issue size and lower market coverage
- Lack of presence in benchmarks and large mutual funds.
iii.) Allocation to high-grade credits: we target essential purpose and essential revenue bonds that have demonstrated sturdiness during economic downturns. See our Three Pillars of Credit Analysis approach.
iv.) Allocation to higher yielding, out-of-favor states: we have low weightings to double-exempt (and often low yielding) states such as California and New York for non-CA/NY residents.
The above has enabled our Tactical Ladder, High Income, and taxable strategies to outperform their benchmarks over a 1-year period.
| Top State Holdings | 1 | 2 | 3 | 4 | 5 |
| Ultra-Short Strategy | IN | MN | NJ | IA | AZ |
| Short Term Strategy | TX | IN | WI | IA | IL |
| Tactical Ladder Strategy | TX | IN | WI | MI | IL |
| High Income Strategy | TX | MI | IN | IL | KS |
Yield Perspective
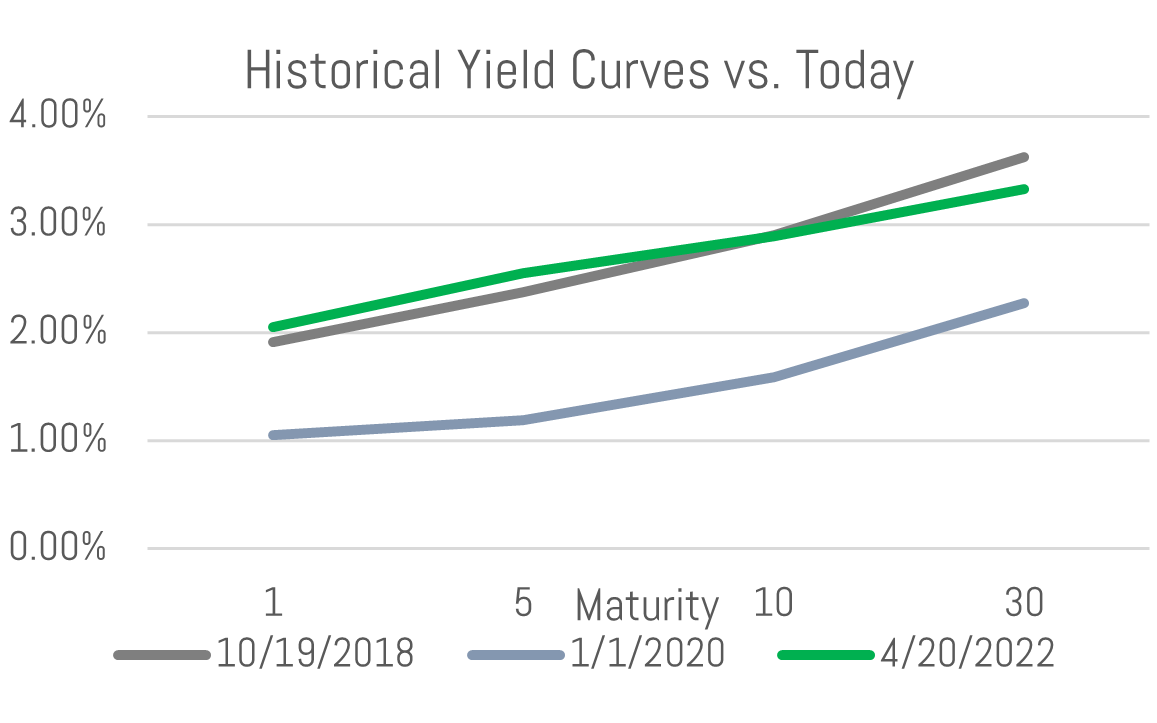
Municipal yields are significantly higher vs. early 2020 when the economy was slowing and before COVID broke out. Yields are at or near the 10-year peak reached in 2018 at the height of the Fed rate hike cycle.
The path of inflation and growth will determine the trajectory of rates from here, but there is no doubt municipals are set up relatively well for outperformance of the treasury and corporate bond market. Outperformance will be based on higher after-tax yields currently offered and a positive credit backdrop for your average municipality.
*****
In summary, municipal yields are very attractive relative to recent history and especially other high-grade fixed income assets. The path of rates from here is unknown as we deal with an extremely uncertain future in terms of predicting the pace of inflation and growth. We believe it is best to diversify across the yield curve within the SMA structure.
Please reach out to your Investment Specialist or Portfolio Manager if you would like to discuss our approach and strategies in more detail.
Sincerely,
Matt Bernardi
Vice President
[1] Oftentimes a bond can be sold – tax loss captured – and replaced with a new similar maturity bond that pays higher levels of interest to offset the tax loss and add higher levels of income over the life of the bond.
[2] When the yields investors earn on short-term bonds surpass those of long-term bonds.
[3] https://www.federalreserve.gov/monetarypolicy/files/fomcprojtabl20210317.pdf
[4] The ISM Manufacturing Index is a monthly indicator of U.S. economic activity based on a survey of managers at more than 300 manufacturing firms. It is considered to be a key indicator of the state of the U.S. economy.