Yield Curve Historical Perspective & Municipal Market Update
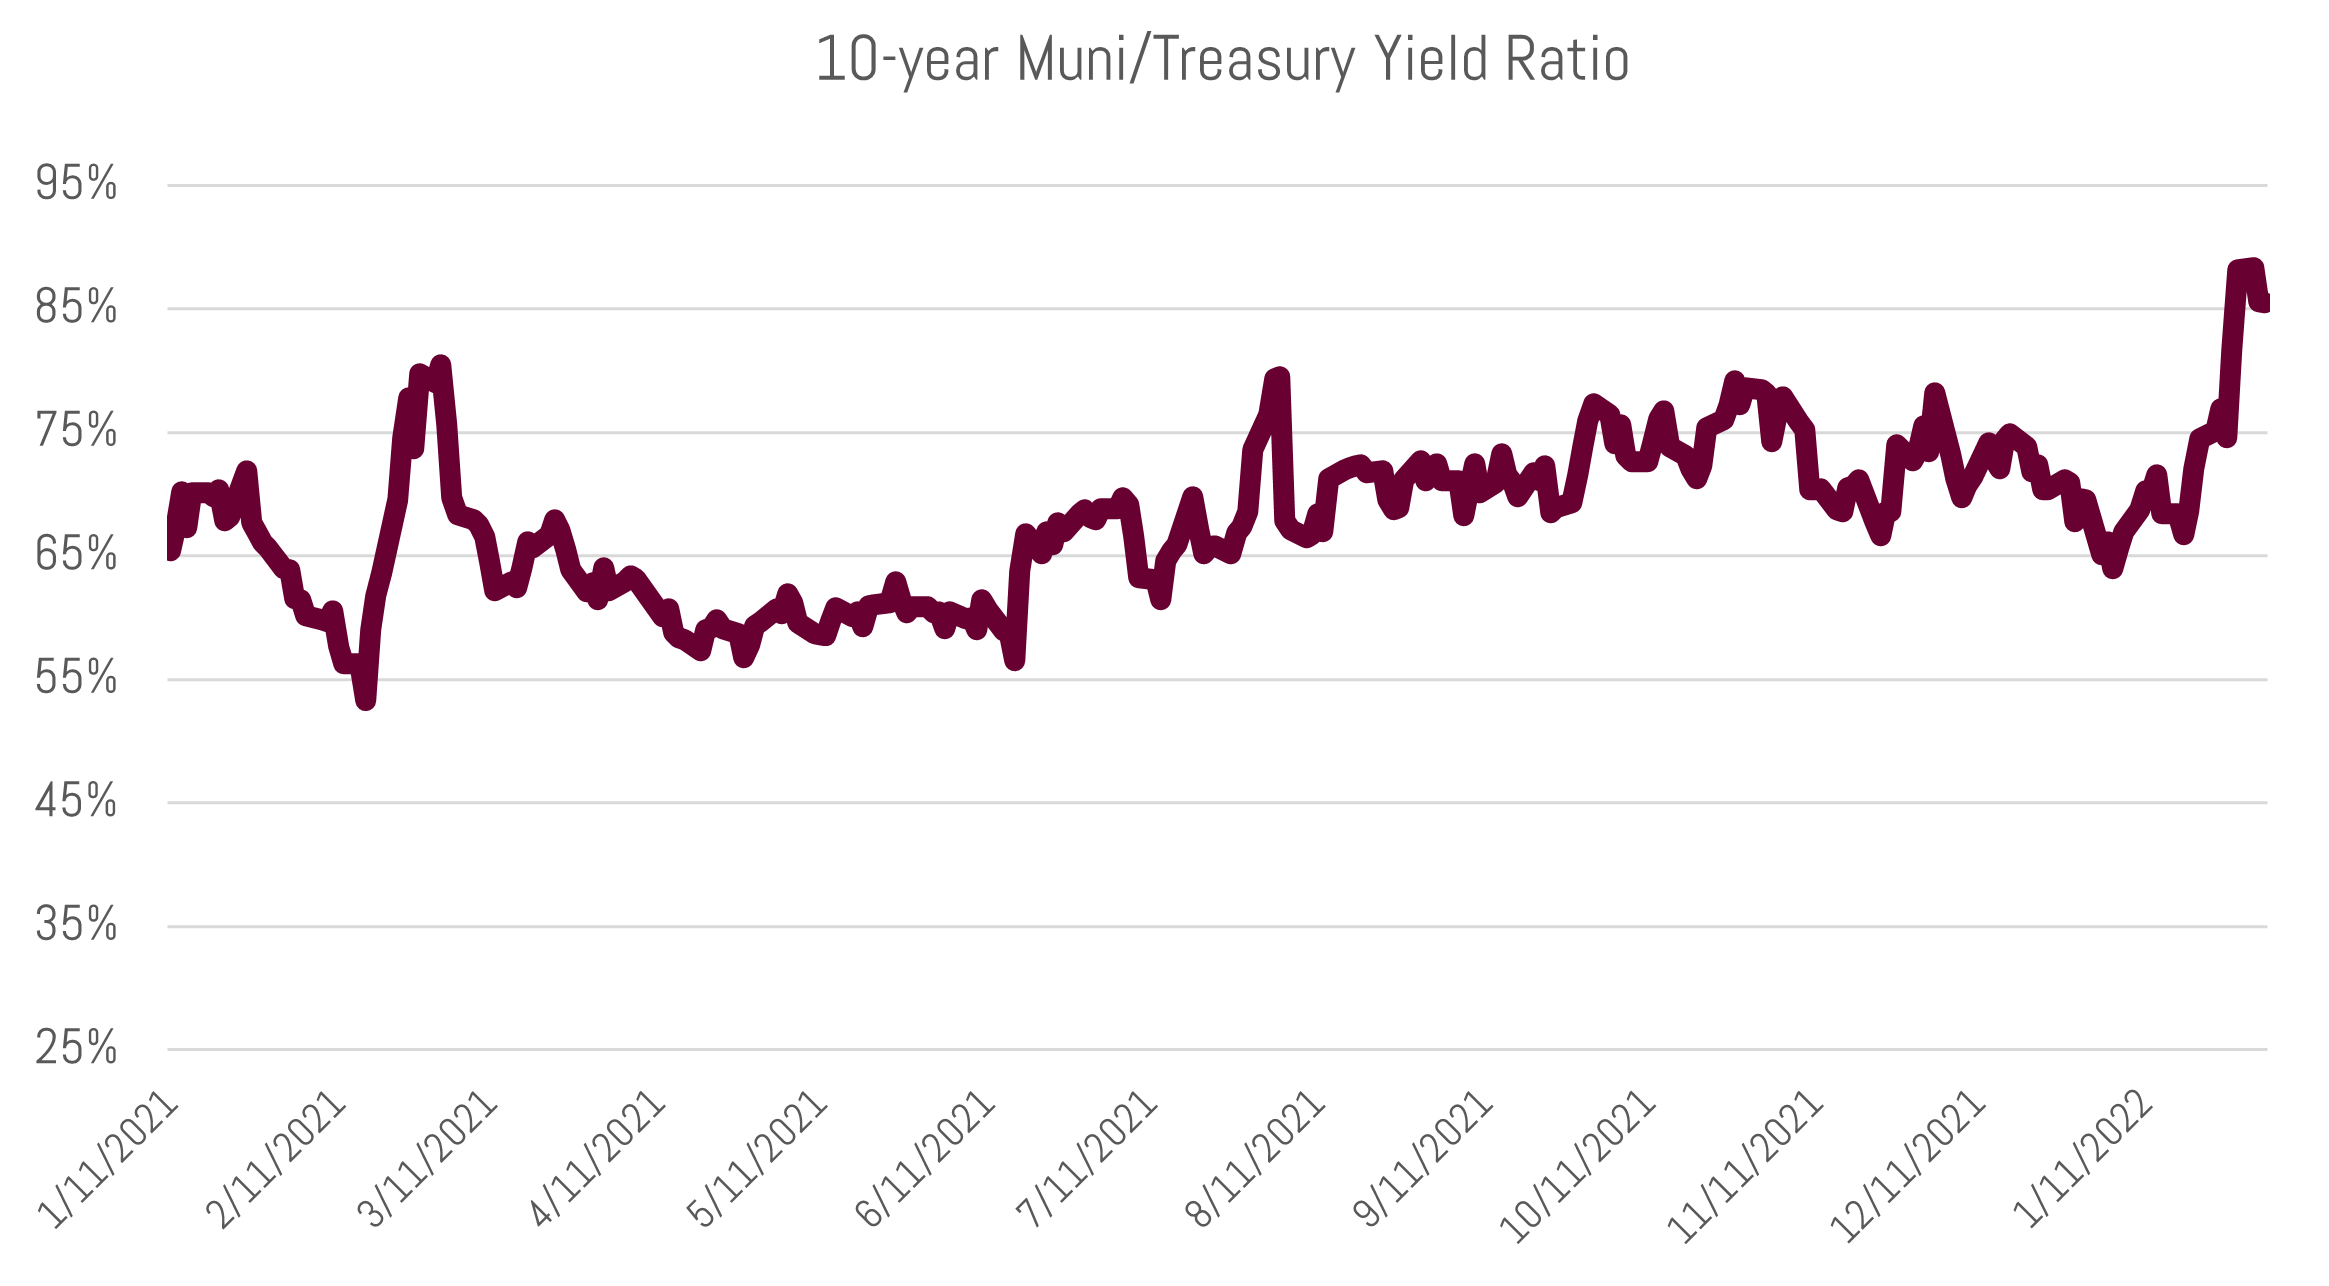
2022 is off to a volatile start in global financial markets as the Fed begins the process of tightening monetary policy. Yields have risen – especially at the front end of the yield curve, thereby flattening the curve. Today the average AA rated 2-year and 10-year municipal bond yields 0.97% (1.53% TEY) and 1.66% (2.63% TEY)1, respectively. This is up from 0.26% and 1.18% at the start of the year. The 10-year muni is now at the same level it was on January 1st, 20202, prior to the COVID outbreak. Yield ratios (municipal yields as a percent of treasuries) have moved higher as muni bond mutual funds recently experienced the largest weekly outflow ($1.4 billion) since April 2020.3 The 10-year AAA muni is currently at a ratio of 85%, which is up from 67% on Thanksgiving and now back to historical averages. As we noted in End of Easy and its Implications for the Municipal Bond Market, higher levels of volatility can be expected as the elephant (the Fed) leaves the room. That said, we expect municipals to remain a bastion of relative stability.
Investor anxiety and today’s market volatility is underpinned by the fear that inflation and higher rates (induced by the Fed) will slow the economy. The Fed’s wind down of bond buying and communications about rate hikes, has mostly impacted the front end of the yield curve.

Source: Bloomberg, MMD; TEY calculated at 37% bracket
The market is now pricing in five rate hikes this year alone, projecting the Fed Funds rate will settle somewhere between 1.25% and 1.50%. At the start of the year, the market was pricing in only three rate hikes. One Wall Street analyst is calling for seven hikes, or one at each scheduled Fed meeting through the rest of this year.
Long term yields have not moved higher at the same pace as short term rates. The reason for this is two parted. For one, short term rates are heavily influenced by Federal Reserve policy and recent Fed communications have indicated higher short term rates in the near future (a la rates hikes noted above). Secondly and alternatively, long term rates are more of a reflection of the market’s view on long term growth and inflation. A 10-year treasury is a projection of where the market believes short term rates will be in 10-years, or roughly 1.77% today. That is not significantly higher than the 2-year treasury, at 1.15%. Essentially the market is expecting an aggressive Fed in the short term (e.g. five rate hikes this year), but a Fed that has limited capacity to raise rates in the long term.
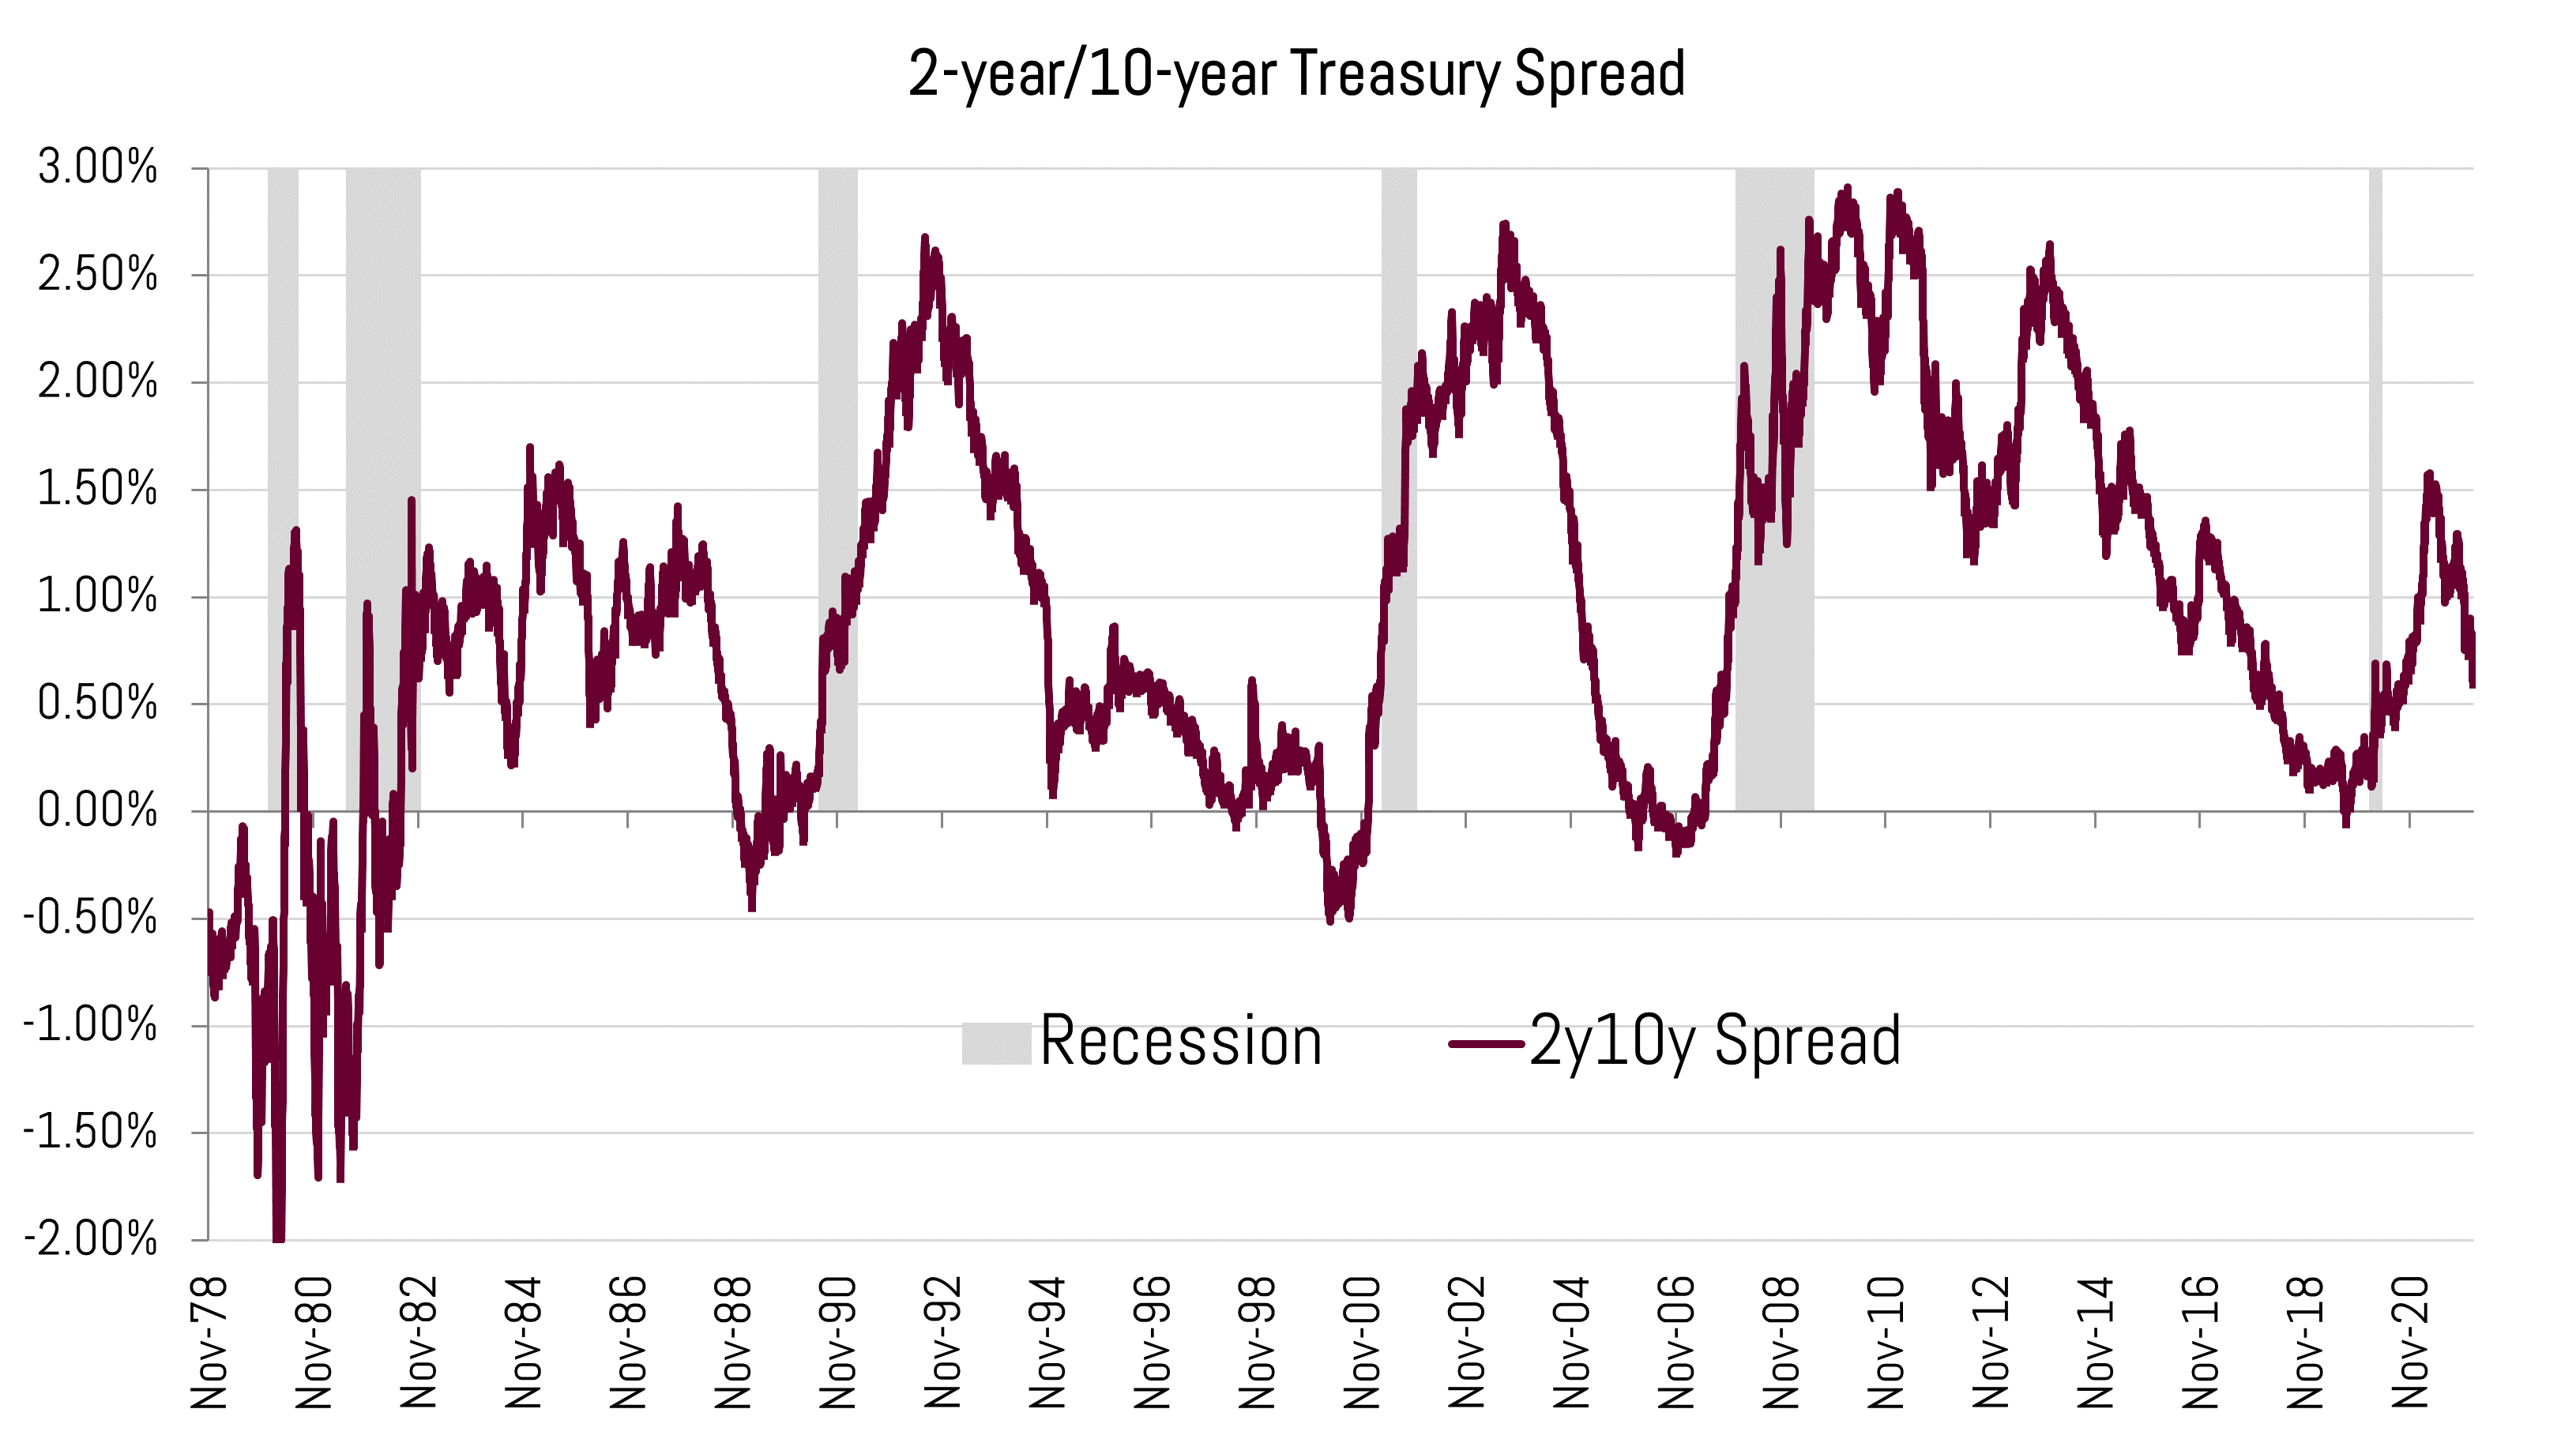
In fact, the difference (“spread”) between the 2-year and 10-year treasury is unusually low relative to past economic cycles. As you can see in the graph below, today’s yield curve never was as steep when compared to the post-recession periods of 2009-2010, 2001-2002, and 1991-1992.4
Today’s flat yield curve shape looks eerily similar to the early 1980s during Chairman Volker’s inflation-crushing run as Fed chairman. The 2y/10y spread has averaged 0.93% since the COVID induced recession ended. This compares to a 0.83% average the 2 years following the end of the 1982 recession. Though yields back then were significantly higher (2-year at 10.87% and the 10-year at 11.61%) the yield curve is communicating the same message about projected growth, inflation, and likely yields.
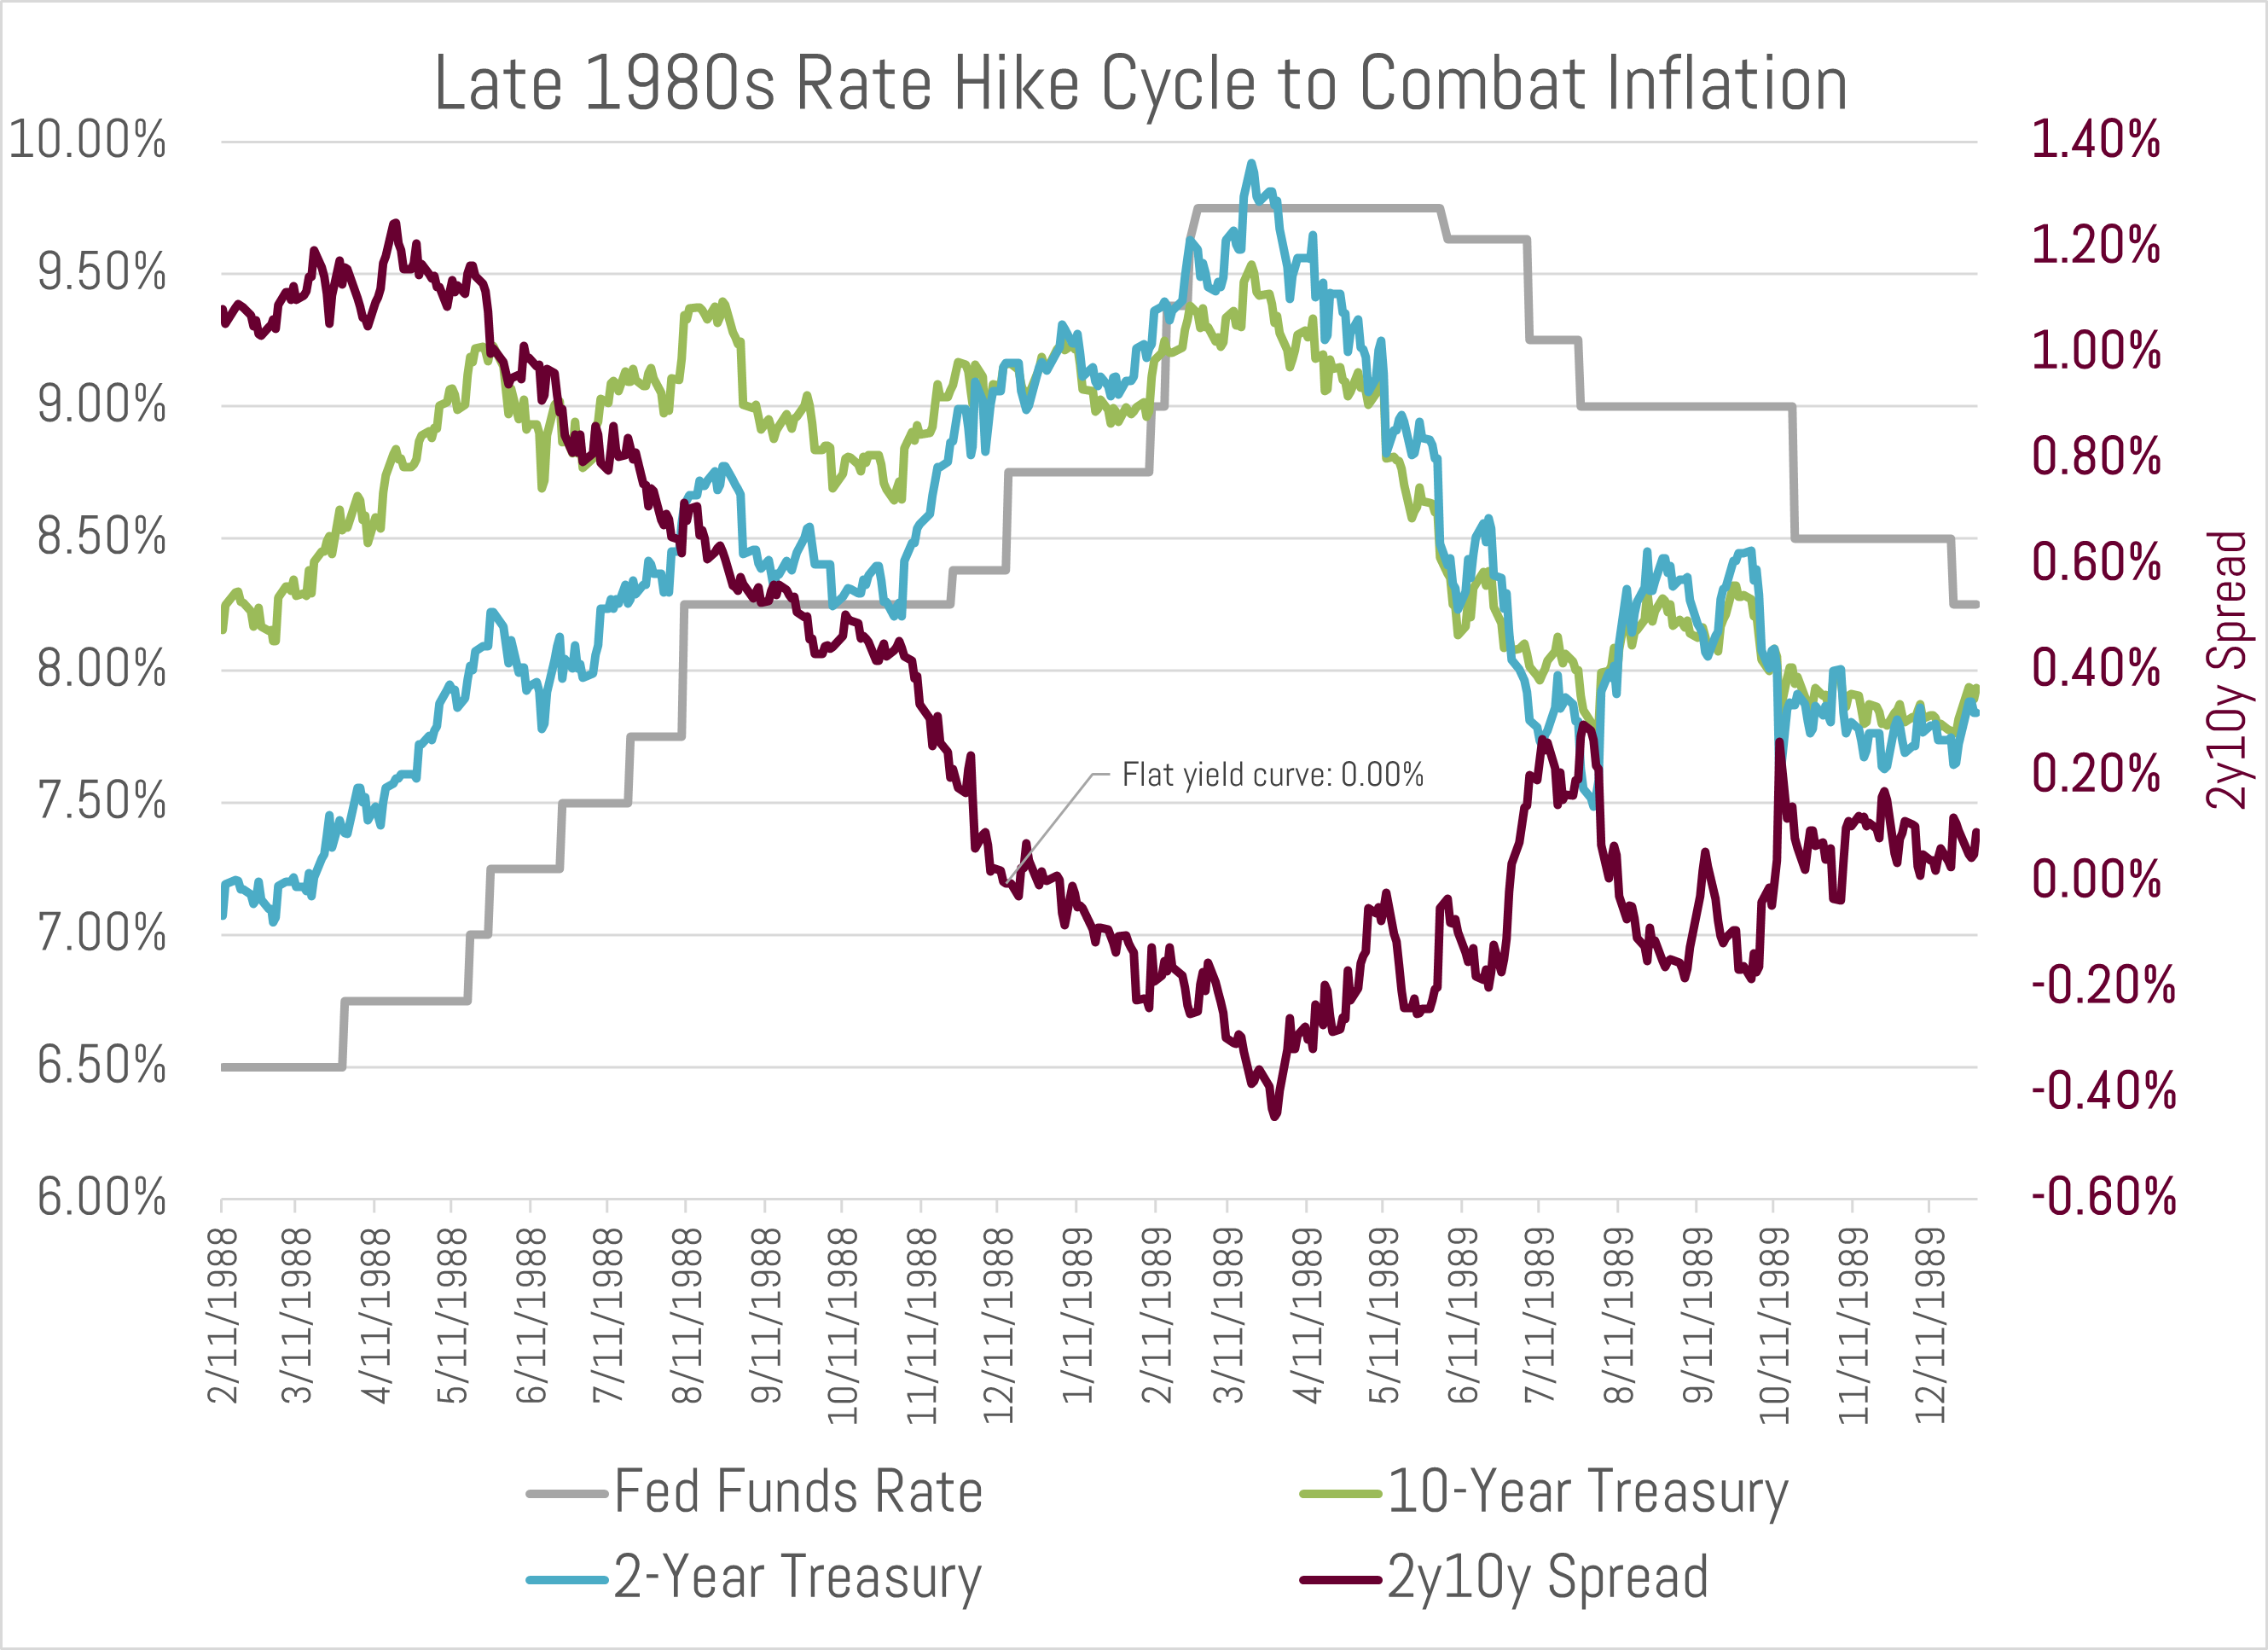
For most of the 1980s the yield curve traded at these flat levels – until Chairman Greenspan started aggressively raising rates in early 1988 to further combat inflation. This flattened the yield curve as the Fed Funds rate was increase from 6.50% in March 1988 to 9.75% in summer 1989. This policy direction ultimately led to a recession in 1990.
During this hiking cycle the 10-year treasury started at 8.15%, and traded as high as 9.54%. It averaged 8.67% or only 52 basis points higher than its starting point. Today’s 10-year treasury started the hiking cycle5 at 1.45% and currently trades at 1.78%.
Similar to 1988, today’s curve structure leaves little room for Powell to raise rates before the curve inverts. The 2y10y curve inverted in December of 1988, only 9 months after Chairman Greenspan started increasing short term rates. Many market participants fear a flat-to-inverted curve (when short term rates are higher than long term rates). An inverted curve has preceded every recession over the past forty years. Many argue whether it’s a signal or source of the recession. In all likelihood it is a combination and, at the very least, an indicator of poor sentiment within the economy.
Attractive Municipal Yield Ratios (Valuations)
In the current environment we are finding attractive valuations within tax-exempt and taxable municipal bonds. The 10yr ratio (10yr muni/10yr treasury) currently trades at 85%. This is above the pre-COVID level of 75%, and up from a low of 53% in early 2021. We expect this ratio to trade between 70-80% and believe a move significantly higher is a buy signal for municipals vis-à-vis other high grade fixed income.
A stable level of the ratio is expected given an excellent credit backdrop for your average municipality, ongoing federal stimulus, and high demand for tax-exempt securities from investors. As nominal rates move higher, we expect demand from investors to increase further, supporting present day ratios.
An additional technical factor we see supporting current ratios is a muted supply outlook. If rates move higher, refinancing bond issues will become more difficult. This will reduce new issue supply and support present ratios, possibly even pushing them lower. Supply estimates for the market are in the $425-500 billion range for 2022, following $475 billion last year. We would not be surprised to see a similar-to-lower level than that for 2022.
****
With a balance sheet of nearly $9 trillion – 25% of the overall treasury and mortgage bond market outstanding – the Fed must toe a very fine line through the balance of the year in calming inflation and market volatility alike. If the late 1980s are a guide, the Fed only has limited room to tighten before flattening the curve and inducing a recession.
Please call us to review or discuss your portfolio positioning. Now may be a great time to reconsider the role municipal bonds play in your overall asset allocation, given that yields and ratios for the market have moved higher and trade at relatively attractive levels.
Sincerely,
Matt Bernardi
Vice President
February 2022
[1]TEY is the taxable equivalent yield calculated at the 37% bracket
[2] Cases of COVID-19 were first reported in late-December 2019 in Wuhan, China.
[3] Source: Week ending January 26th; Lipper US Fund Flows
[4] The COVID induced recession of 2020 – which was the quickest recession on record – officially lasted from February 2020 to April 2020. Source: National Bureau of Economic Research
[5] Mid-December, or when the market started pricing an early 2022 hike


