Muni Market Update: Spooky but Sustainable Supply
Now that it’s officially October—and finally a justifiable time to break out the Halloween decorations—municipal supply remains elevated and on pace to reach record annual levels. In 2024, issuance reached a record $460 billion, but this year is projected to far surpass it, with an estimated $580 billion in total issuance.[1] The market experienced intermittent indigestion with the high level of supply, but largely gained its footing over the past month. The Bloomberg Municipal Bond Index returned 2.26% – its best month since December 2023.[2] Furthermore, duration outperformed[3] as investors finally stepped in on the long end to capture high tax-exempt yields. As we head into the final quarter of this year, we see continued attractiveness in the intermediate portion of the yield curve (10-15 years), supported by favorable supply dynamics into year end. That said – should the economy hold in and inflation plateau – the treasury curve is pricing in a hefty number of cuts that may not materialize.
SPOOKY SUPPLY
Municipalities are bringing debt to market at a breakneck pace in order to upgrade infrastructure and makeup for years of subdued issuance. Demand should continue to meet this supply backdrop, underpinned by a generally st urdy credit profile for the sector and a stable macro economy. Recent fund inflows demonstrate investors are starting to catch on. Strong returns naturally parallel high inflows and we’d expect demand to remain robust as ~4% tax-exempt yields are readily available in the intermediate portion of the yield curve. At the top federal bracket, this equates to a taxable equivalent yield over 6%, a spread over 200 basis points higher than the current 10-year treasury.
Supply is running approximately +15.5% higher year-over-year, a meaningful increase that has kept municipal-to-treasury ratios elevated throughout the year. Looking ahead, 2026 is expected to deliver another year of heavy issuance, though year-end seasonality remains favorable for the market. See below a graph of year-to-date issuance in orange compare to the five previous years.

Source: Bloomberg
The American Society of Civil Engineers’ 2025 Report Card assigned U.S. infrastructure an overall grade of C, with scores ranging from B (ports) to D (stormwater and transit). Encouragingly, for the first time since 1998, no category was rated D−, and eight of eighteen categories improved. Still, the overall infrastructure deficit exceeds $2.9 trillion, underscoring the extent of deferred investment and the society’s conclusion that the “bill on our infrastructure systems was past due.”
Because municipalities are the primary source of infrastructure financing, it is unsurprising that issuance is at record levels. Assuming credit quality remains broadly intact, we expect robust supply to persist for years to come. Should ratios/yields remain at these current elevated levels, we expect investors to continue to recognize the relative value offered by municipals. This demand dynamic should continue to absorb heightened supply. Importantly, municipalities remain broadly well positioned fiscally, enabling them to raise debt to finance urgently needed infrastructure projects. Moody’s notes that the median rating for municipal issuers is Aa3, three notches below Aaa.[4]

THE FED’S PATH AHEAD
Further supporting returns this past month, was increased market confidence in Federal Reserve rate cuts following weak payroll numbers. Though inflation has plateaued in the high 2% to low 3% range (above the Fed’s 2% “target”), most agree the Fed Funds Rate (FFR) remains in restrictive territory at 4.25% (following a 0.25% cut on 9/17).
The gap between the FFR and CPI year-over-year (YoY) indicates the Fed is currently at its tightest stance since before the Great Financial Crisis (GFC). Concerns over tariff-driven inflation—and perhaps some lingering caution after the COVID-era spike—have kept policymakers from pursuing deeper rate cuts.
The chart[5] below plots this difference since 2007. The red gaps indicate a FFR above CPI YoY, while the green indicates the opposite. Red indicates restrictive monetary policy, while green stimulative. As you can see, the Fed has generally kept the FFR below the underlying rate of inflation since the GFC.
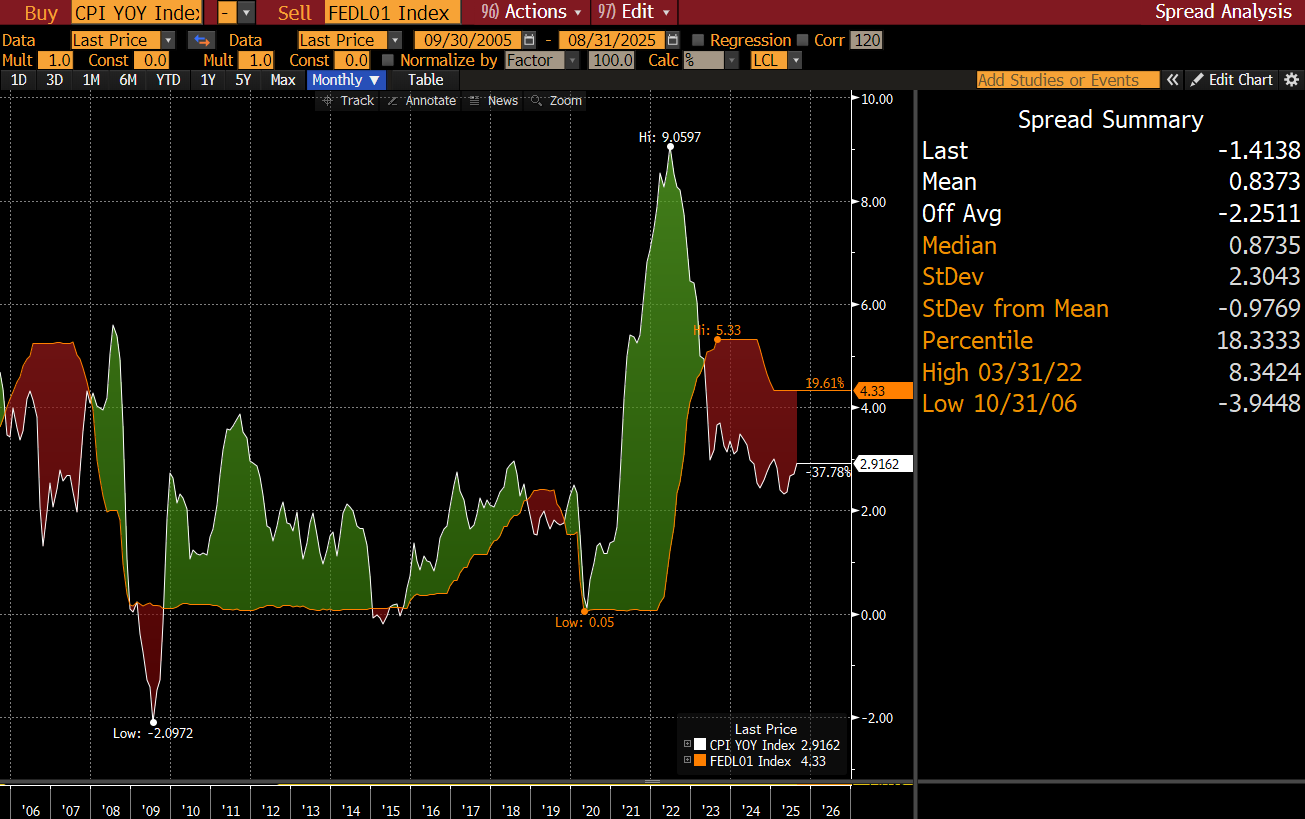
Source: Bloomberg
Interestingly enough, the Fed’s approach as of late is not entirely different from their pre GFC approach with a FFR consistently higher than the rate of inflation.

Source: Bloomberg
This restrictive dynamic, paired with weak employment data as of late, is in why the market is pricing in another four cuts (1.00%) through 2026. What actually transpires will depend on the trajectory of employment and inflation trends.
Another FFR cut (to 4%) at the end of October is highly likely. We’ll get another payroll and CPI print before then, though economists aren’t anticipating significant changes in either. Should both indicators hold in though the end of the year, the treasury market may slightly reduce its projections for further cuts, slightly pressuring bond prices and moving yields higher. Fed members recently projected the FFR to end at 3.40% at the end of 2026 while the market is pricing in more aggressive cuts to a 3% level. This is a bit of a disconnect between policymakers and the market.
In many ways, the bond rally since early summer has been stimulative in of itself and we may not need further aggressive Fed easing if the job market stabilizes. For example, the 30-year mortgage rate has moved from over 7.40% at the start of the year to 6.35% today.[6] Mortgage applications spiked 10% and 20% in the first two weeks of September.[7] Should this help stem some of the weakness experienced in the economy, and inflation continue to plateau, the market will need to reduce rate cut projections in 2026.
WHERE WE SEE VALUE
We remain modestly overweight duration relative to our positioning over the past 3–6 months. The municipal yield curve continues to appear steep compared to other high-grade fixed income sectors, supporting the case for medium-to-long-term outperformance. While ratios on bonds maturing inside of 10 years have cheapened recently, they remain less compelling than longer maturities. Should the Fed accelerate its rate-cutting cycle, the long end of the curve has meaningful room to rally. Conversely, if cuts fall short of market expectations, the combination of high tax-exempt yields, favorable ratios, and attractive end-of-year supply dynamics should still support municipals relative to other high-grade fixed income.
As always, we emphasize a laddered maturity structure to balance potential outcomes while ensuring consistent cash flows. At present, we are targeting ~3% tax-exempt yields at the front end and 4–4.50% further out the curve.

Source: Bloomberg, MMD, October 3rd, 2025
If you have any interest or questions about this process, please contact your Investment Specialist or Portfolio Manager.
Sincerely,
Matt Bernardi
Sr. Vice President
[1] Bank of American forecast; source Bloomberg
[2] Source: Bloomberg Municipal Bond Index Total Return, LMBITR Index, Bloomberg 9/30/2025
[3] For example, the Bloomberg 1-15 Year Municipal Index returned 1.45% during September compared to the Bloomberg Municipal Bond 7-year Index at 1.16%.
[4] Source: Moody’s Analytics – US Municipal Bond Default History and Recovery Rates, 1970-2023; October 24, 2024
[5] Source: Bloomberg; spready between the Fed Funds Effective Rate and CPI YoY since 9/30/2005
[6] Source: Bloomberg, Bankrate.com
[7] This was largely driven by refinancing applications, but stimulative, nonetheless.