Halftime Report – Muni Yield Dynamics & OBBB Passage
President Trump signed Bill Act H.R.1 on July 4th and with its passage, any current threat to the tax -exempt status of municipal bonds ceased. This was a threat we believed was unlikely to become reality, but with the capricious nature of today’s politics, never worth taking for granted.
As we noted in December of last year: “The benefits of tax-exemption cannot just be measured in dollars alone, and we expect its importance to be highlighted and preserved throughout the tax negotiation process.”
This is a significant ‘WIN’ for states, counties, cities, villages, school districts and hundreds of other local governmental units across the country.
Tax-exempt municipal bonds have financed low cost infrastructure projects in communities across our nation since the ratification of the Sixteenth Amendment to our Constitution in 1913. The Revenue Act of 1913 established federal income tax and also included a provision exempting interest on state and local municipal bonds from federal taxation. This provision was included by the 63rd United States Congress because it understood the critical role tax-exempt municipal bonds played in building a growing nation’s public infrastructure.
Sensibly and thankfully, the 119th United States Congress understands the vital nature of municipal bonds to every single congressional district and it left tax-exemption intact.
It’s a gratifying result after many months of intense discussions and lobbying by thousands of communities’ representatives, local government officials, and other market participants.
“Bravo” to everyone on a collective effort very well done. Our communities will benefit from these efforts for many years to come.
ATTRACTIVE MUNICIPAL BOND YIELDS
A surging new issue supply and the impressive absorption of it by investors has been a major story in the first six months of 2025. Issuance during the first half of the year was approximately $280 billion, an approximate 14% increase year-over-year. The new year began with a robust new issue calendar, an unusual dynamic for the municipal bond market. And this dynamic persisted into mid-summer. California, New York, and Texas led the issuance parade.1 For the most part, impressive investor demand kept pace with this strong new issue supply.
Yields increased at certain points due to supply pressure, and yields are higher at the long-end of curve compared to the start of the year levels. The table below of the “A” rated MMD Index2 illustrates the point:
| DATE | 5-Year | 10-Year | 20-Year | 30-Year |
| 01/02/2025 | 2.91% | 3.17% | 3.83% | 4.12% |
| 06/30/2025 | 2.72% | 3.39% | 4.51% | 4.76% |
Source: Bloomberg, July 9th, 2025
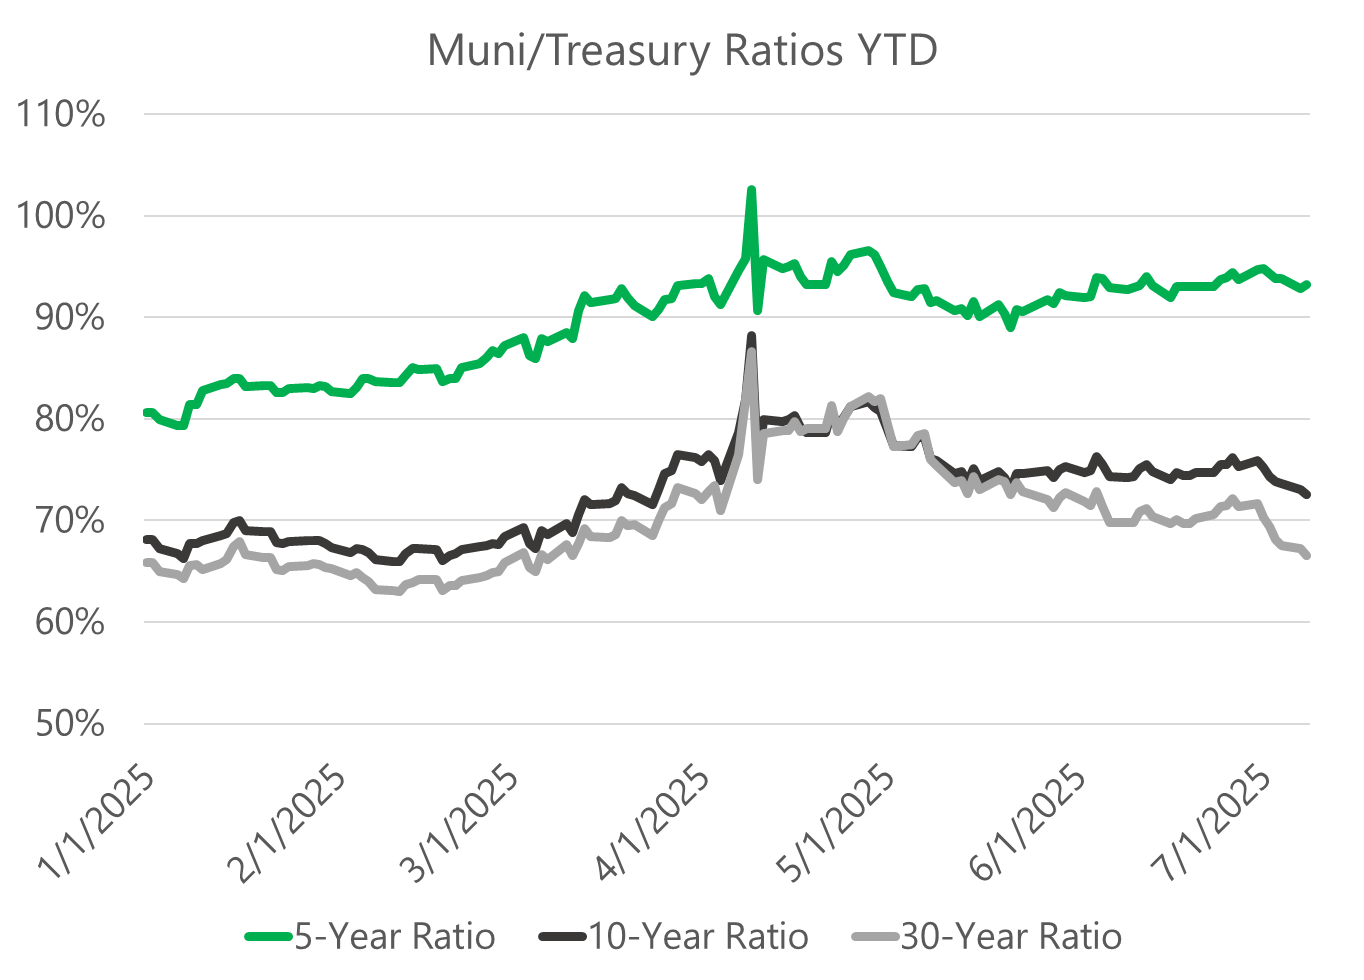
Bottom line: The best relative value continues to sit at long end of the yield curve where ratios range from 80%-100% of the corresponding treasury. These are attractive absolute and relative levels in our view. A 4.50% non-taxable municipal bond yield approximates 7.14% taxable equivalent for a taxpayer in the 37% federal income tax bracket.
We expect the new issue supply to wane in July-August, as is customary, but remain above 5-year averages. We expect it to pick up post Labor Day and remain elevated the balance of the year before falling off post-Thanksgiving. Overall, 2025 new issuance levels will significantly surpass 2024 record supply levels.
We believe the continued robust supply and resulting elevated municipal bond yields allows investors to lock in attractive high yields in this sector. Periodic market volatility and corresponding dislocations are likely to continue in the coming months. Investors should study both primary and secondary market sourcing for investments toggling between the two markets as values wax and wane in each.
CONTINUED OPPORTUNITIES FOR TAX LOSS HARVESTING
One of the features of a separate account portfolio, is the ability to surgically manage tax liabilities. In this case, you can pick and choose which bonds to sell/buy and how much in tax losses you would like to capture. Tax losses can be used to offset regular income up to $3,000 and carry forward to offset capital gains you may have elsewhere in your portfolio(s). This has been a popular portfolio strategy as of late and a way to both increase cash flow, restructure portfolio into higher coupons, and capture losses to benefit your end of year tax liability.
When we conduct our tax loss swap analysis we consider selling vs. buying yield, tax loss captured, payback period of the tax loss vs. increase in cash flow, portfolio structure and duration changes, among other metrics. If you have any interest or questions about this process, please contact your Investment Specialist or Portfolio Manager.
Thank you for your continued confidence in our team and allowing us to assist you in navigating today’s fixed income market.
Sincerely,
Ronald P. Bernardi
President & CEO
[1] Source: Bloomberg
[2] Source: Municipal Market Data, June 30th, 2025