Are the Bond Vigilantes Back?
Yields moved up precipitously during the month of September as the AAA rated 10-year municipal has moved from 2.85% on August 31st to 3.52%[1] today. 3.52% is equivalent to a taxable rate of 5.58% calculated at the 37% bracket. This bond selloff (higher yields) has pulled the 10-year treasury to 4.84% as of this morning after a great jobs report. This is its highest level since 2007 – pre Great Financial Crisis. The underpinning of the selloff is the i.) market’s “higher-for-longer” forecast of Federal Reserve policy ii.) a resilient economy in the face of significant rate hikes over the past year and a half and iii.) a potential supply/demand imbalance for treasuries.
The latter point echoes the 1990s and James Carville’s famous remark: “I used to think that if there was reincarnation, I wanted to come back as the president or the pope or as a .400 baseball hitter. But now I would like to come back as the bond market. You can intimidate everybody.” Or an even further back historical reverberation would be Henry Kaufman’s warnings in the 1970s and 80s. Kaufman, then chief economist at Salomon Brothers, earned the nickname “Dr. Doom” after his various warnings about government policy.
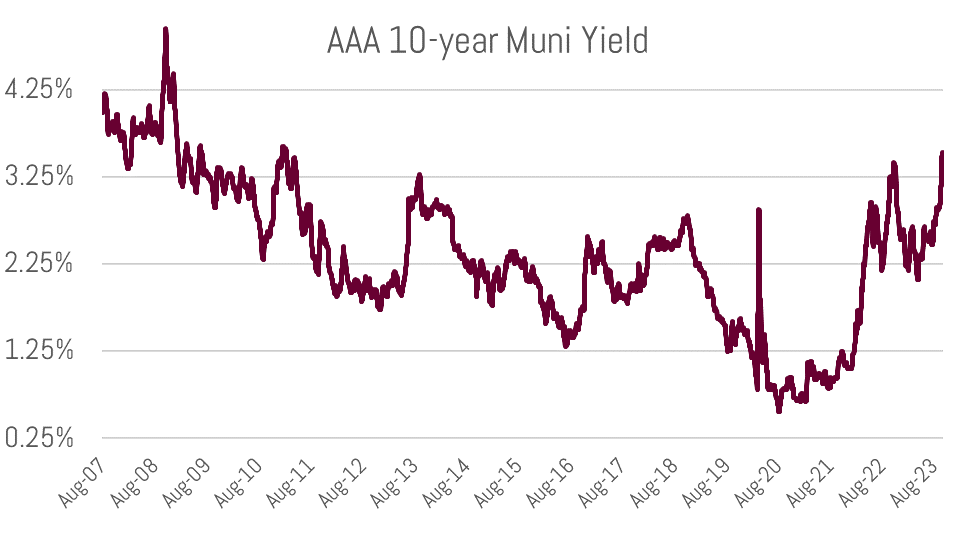
10-year municipal yield moves to a 10-year high (source: Bloomberg)
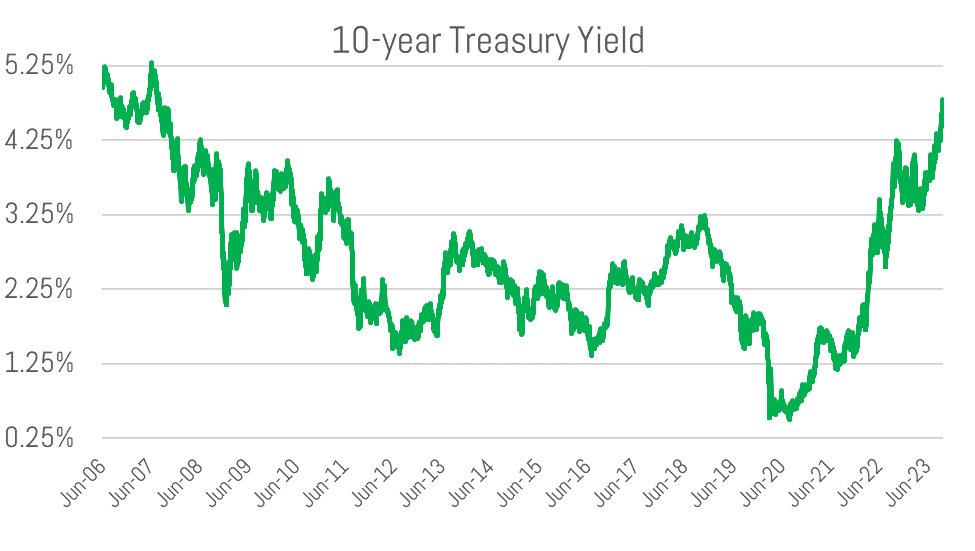
10-year treasury yield surpassing pre-financial crisis highs (source: Bloomberg)
1990’s Redux
Fueled by concerns about federal government spending, the “Bond Vigilantes” of the 1990s caused severe volatility in the treasury market. The 10-year rose from a 5.16% yield in October 1993 to over 8% by the end of 1994. And it was a double-edge sword of fiscal and monetary policy pressure for the bond market, as the Fed raised rates from 3% to 5.50% in 1994 alone.
Alternatively, today’s most recent selloff is not accompanied by Fed Funds rate hikes, as they have not raised since July and the market’s expectations for them raising again has barely budged.[2]
Such volatility based on fiscal concern in a developed country’s debt market is not unique in more recent times. Britain experienced a similar episode in the fall of 2022. When large tax cuts, paired with new spending plans, were announced to Parliament, the pound fell significantly in value and their government debt shot up in yield. This led to the abrupt resignation of the newly elected Prime Minister, Liz Truss after only six weeks in office and a rethinking of the country’s fiscal plan.
Fitch’s August 1st downgrade of its rating on U.S. debt helped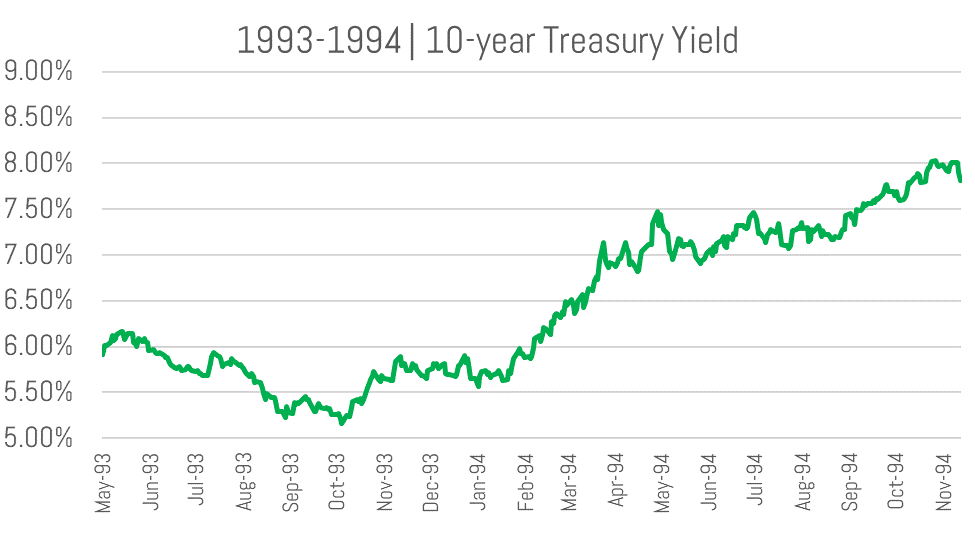 fuel the market’s fire.[3] But what underpins the potential supply/demand imbalance is a variety of variables including high-to-increasing debts and deficits, the Federal Reserve balance sheet runoff (Quantitative Tightening), and a continued decrease in Chinese treasury holdings.
This dynamic also had a self-fulling aspect to it, as government borrowing costs rise so does the cost to service debt, thereby increasing the supply of debt. Lather, rinse, repeat and the vicious loop continues.
Typically, investors need only to focus on growth, inflation, and resulting Fed policy to give context to bond yields. However, the emergence of a fiscal variable in explaining yields is emerging as a major focal point.
Our Approach to Current Market Dynamics
Broadly, choppy markets like today are typically an excellent long term buying opportunity. Furthermore, taxable equivalent yields of 6-7% now readily available are historically high nominal rates.
The lagging impact of monetary policy, paired with a decreasing money supply, should continue to reign in inflation and, therefore, today’s restrictive monetary policy from the Fed. One interpretation of restrictive or “tight” monetary policy is when the Fed Funds Rate (5.33% today) is above headline CPI and/or core CPI. These recently printed at 3.7% and 4.3%, respectively. However, the Fed Funds Rate did not move above headline CPI until this past April. Therefore, it could be argued we were in stimulative monetary policy territory until then – a full three years after the COVID crisis.
Through the late summer of this year, we favored the front (1-2 years) and long-end (12-20 years) of one’s ladder to capture relatively high rates and underweight the “belly” (3-10 years) of the yield curve, which we found overvalued.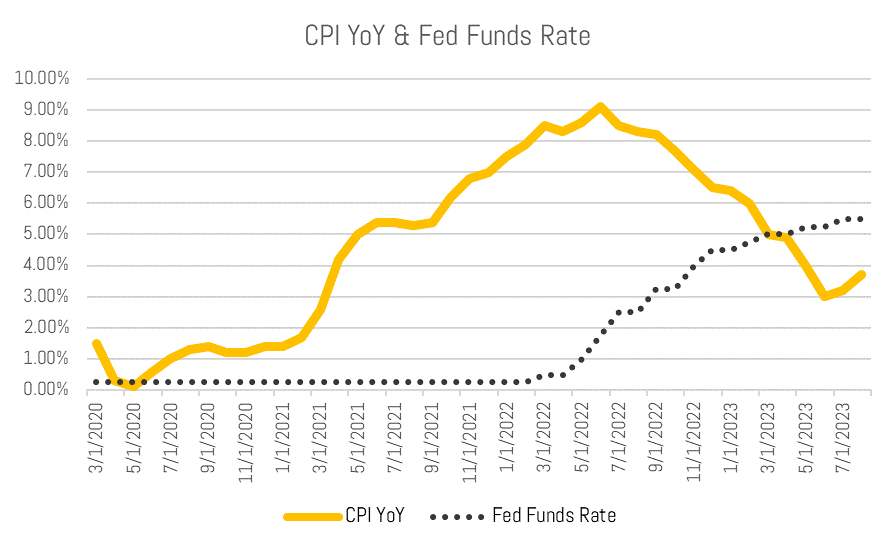
Money market funds paying 4% tax-exempt are certainly attractive, but – as new cash or maturities become available – we think targeting the intermediate portion of the yield curve at 3.80%-4% and long term, targeting 4-4.50%, is attractive for long term returns. For the more income-oriented investors – where duration risk is secondary to maximizing yield – we would overweight the latter rungs of a ladder.
A 4.50% tax-exempt yield is equivalent to a 7.14% taxable return. Over the last 30 years, the S&P has returned 7.70% annually without reinvestment of dividends and 9.68% if reinvested.[4]
An investment grade municipal portfolio at such yields not only offers a locked in yield but also significant protection from a credit perspective. Should a “soft landing” ensue, credit is certainly less important than duration risk, but during any sort of economic turbulence, a high level of credit safety is vital as part of your overall asset allocation.
Don’t hesitate to reach out to your Investment Specialist or Portfolio Manager with any questions about the market or your portfolio.
Sincerely,
Sr. Vice President
[1] Source: Bloomberg AAA rated BVAL Yield Curve, 10-year
[2] According to Fed Funds futures, there is a 25% chance they will raise rates in November. This is up (insignificantly) from 11% on August 31st.
[3] Moody’s remains the only major rating agency with a Aaa rating on U.S. sovereign debt.
[4] Source: Bloomberg