Municipal Market Update| Pick Your Spots
Persistently low supply met with sturdy demand is keeping municipal yields at bay, even as Fed rate cut projections get kicked further and further out the calendar. The nature of the demand has created a tale of two municipalities along the yield curve with attractive long term rates (12-20 years), but relatively unattractive yields in the intermediate (2-11 years) portion of the curve. Therefore, it is a market that warrants patience and tactical implementation of cash. Fortunately, most ladders roll over into the longer portion. That said, patience is rewarded with attractive money market fund yields (~3.40% tax-exempt). But investors must understand these high yields on cash will be fleeting if the Fed starts cutting rates. We believe one should diversify exposure across the curve, aiming to lock in similar-to-higher rates as these money market funds currently provide.
Today’s market demand for municipals in the intermediate portion of the curve (2-11 years) is driven by passive fund investors and large managers forced to buy into low supply. These investors are passive in that they allocate in accordance with the benchmark and largely must buy what is currently on the shelf amongst the largest issuers. These strategies are driving ratios (the percentage of a muni yield to concurrent treasury yield) to historically low and irrational valuation levels, in our view.
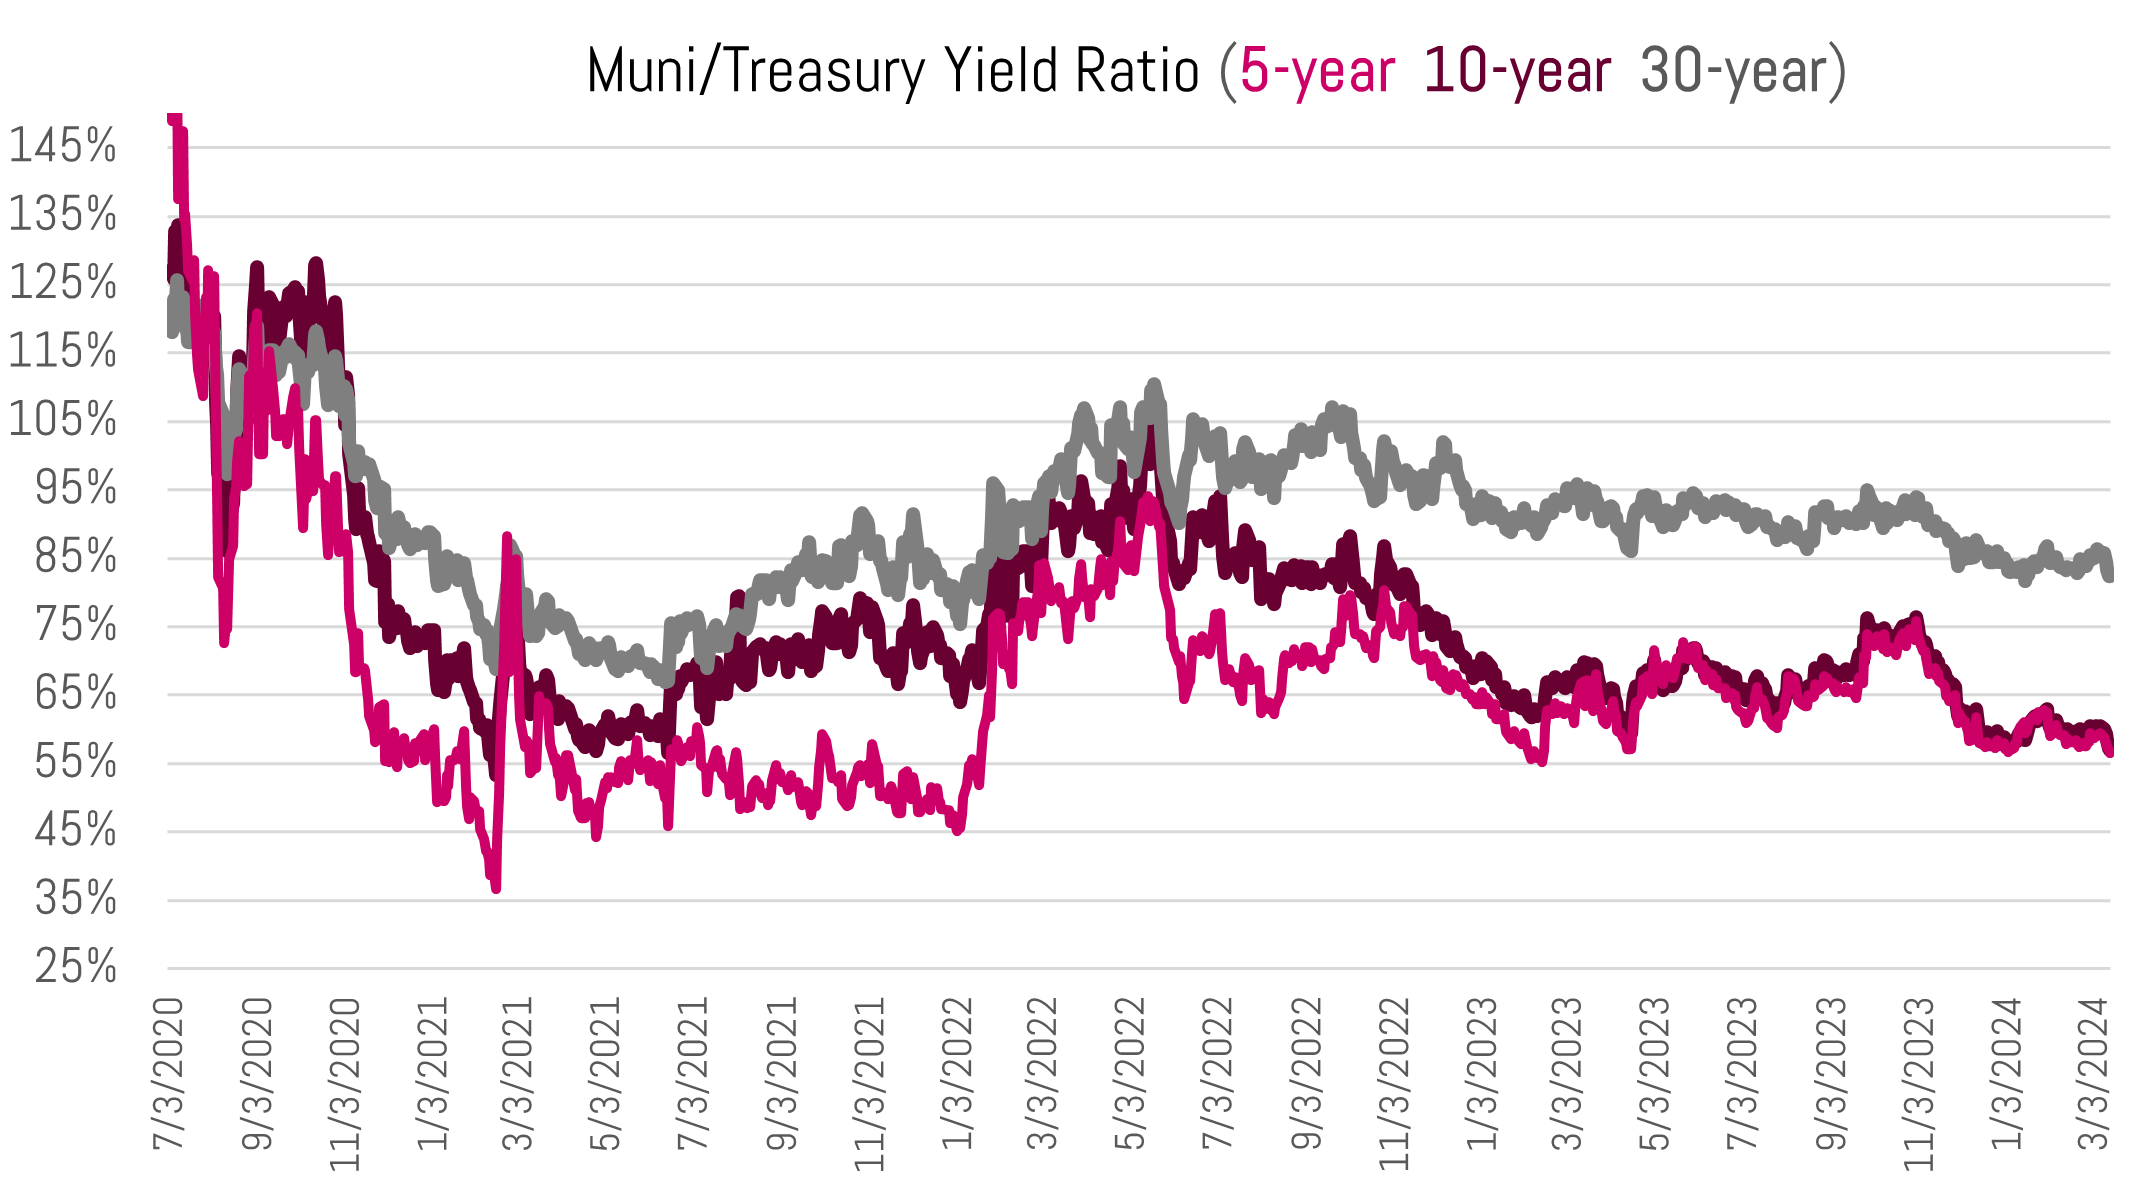
What you are seeing in the chart above is 5 and 10-year muni ratios nearing their post COVID-era lows. This means munis are at historically “rich” valuations in this portion of the of the curve. However, the longer-end portion of the curve (grey line) has not tracked the intermediate portion to such low ratios, a break from recent historical correlations (see how all three lines basically tracked each other until the summer of 2022).
These 5 and 10-year benchmark rates[1] are overpriced when taking into account their taxable equivalent yield and alternative fixed income assets. The 5-year AAA Muni BVAL rate is 2.42% today, which is 55.76% of the 5-year treasury (4.34%) and equivalent to a taxable yield of 3.84% at the 37% bracket.[2]
Why would anyone (or product) buy a 3.84% taxable equivalent yield when you can purchase a similar maturity treasury at 4.34%? The answer lies within passive index funds and separate account strategies that mimic them. These products largely must buy what is stipulated by the benchmark. Given a low supply market, ample competition amongst funds and underwriters alike, and continued inflows into these products, this has created a feeding frenzy for bonds in this portion of the curve.
It is our opinion the longer end of the curve has not traded to irrational levels given the above mentioned products are simply not as active in this portion of the curve and due to inherent duration risk in longer bonds, as well.
We clearly live in a siloed market right now where supply and demand dynamics are driving price. Even if this price is unattractive relative to other high-grade fixed income.
Our Approach Given This Dynamic
- Patient cash implementation
- Let the ladders roll (In honor of National Ladder Safety month, of course)
- Avoidance of benchmark names
Cash: Fortunately, investors are currently paid for patience as tax-exempt money market funds yield 3.25%-3.40%. These yields are relatively attractive to most intermediate maturity municipal yields (i.e. inverted curve) and taxable alternatives. The risk here lies in that the Fed is expected to cut short term rates, which will pull these floating yields down and also, potentially intermediate-to-long-term yields, as well. With new cash added to portfolios, therefore, we are gradually implementing across the yield curve at target average yields equal to money market fund yields. Essentially, we are aiming to lock in these high short term yields in a laddered portfolio.
Ladder: A historical benefit of the ladder and what our investors are experiencing today, is that we typically roll over matured proceeds at the longer-end (15-20-years) of the ladder. Given fair valuations and tax-exempt yields of 3.50%-4.00% (5.55%-6.34% taxable equivalent) in this portion of the curve, we find these bonds relatively attractive and are able to largely avoid the intermediate bonds unless directed otherwise.
Beware of benchmarks: Today’s municipal benchmarks are generally allocated to big names located geographically on the coasts (CA & NY). Given high state tax rates in NY and CA, it makes sense for instate residents to over allocate to instate bonds. However, for residents in the other forty-eight states, it generally does not.
Furthermore, big deals get big attention from the big fund/SMA providers. This often leads to small yields and small spreads for the issuers and investors alike. Especially in times of low supply.
For example, on Monday March 11th the State of Ohio (AAA rated) issued nearly $174,000,000 in bonds with the 5 and 10-year bonds yielding 2.45% and 2.48%, respectively. Good for the State of Ohio to borrow at such low yields, but we avoid these types of bonds in our SMA portfolios and pity the investors who locked in taxable equivalent yields under 4%.
Instead, we are targeting tax-exempt yields of at least 2.90% in this portion of the curve. This equates to a taxable equivalent yield of 4.60% – a positive spread to the concurrent treasury.
As always, let us know if you have any questions about current market dynamics or your portfolio. Thank you for your confidence in our team and reading our market commentaries.
Sincerely,
Matt Bernardi
Senior Vice President
March 2024
[1] Benchmark yield source: Bloomberg BVAL Muni AAA Curve
[2] All taxable equivalent yields referenced hereafter assume a 37% tax bracket.
