Municipal Market Update: The Best Defense is a Good Defense
The Fed on Wednesday raised its target range for the Fed Funds Rate by 50 basis points (0.50%) to 4.25%-4.50%. The Fed Funds Rate (FFR) most directly impacts short term treasury rates, while bonds 5-years and beyond are primarily priced based on market forces and the expectations for future growth, inflation, and resulting Fed policy.
A 4.50% top end of the FFR is the highest level since 2004 and has risen at a much quicker pace compared to the previous four hiking cycles. This year, the Fed has raised rates the same amount (4.25%) as it did in 2004-2006, but in 1/3rd the amount of time.
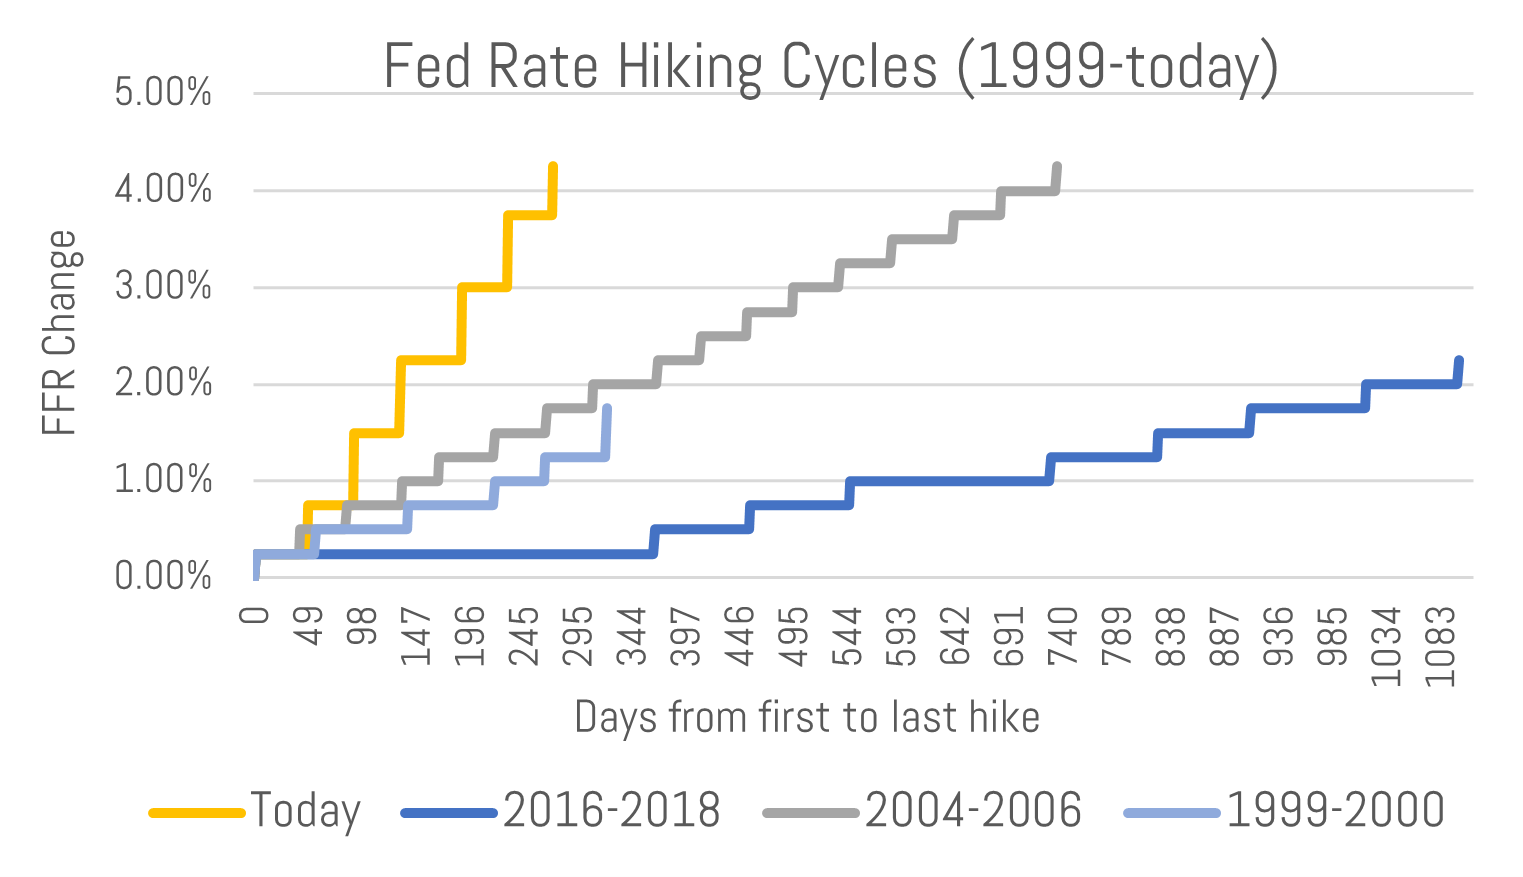
Source: NBER & Bloomberg
This steep pace of rate hikes (orange line in graph above) reflects the high and persistent levels of inflation the Fed is trying to combat. Higher short term rates (caused by the Fed) raise borrowing costs for consumers and can reduce bank liquidity, thereby reducing loan availability. This all reduces demand and, potentially, the levels of inflation.
We are seeing significant signs of weakness in the economy largely caused by the rate hikes:
-
- The Leading Economic Indicators Index1 turned negative in June and has proceeded to move lower over the past three months.
- The U.S. treasury yield curve is massively inverted as the 2-year yield recently exceeded the 10-year yield by 80 basis points (0.80%), a level not seen since 1980. Every recession of the past 60 years has been preceded by yield curve inversion,
- Building permits issued have fallen to August 2020 levels, a time when we were in the early innings of the COVID economic recovery.
- US Manufacturing PMI – a sentiment survey amongst domestic manufacturers – dipped into recessionary territory in November and is at a level not seen since the summer of 2020 (the height of the COVID economic turmoil).
The Fed is now seemingly in a precarious position of continuing to combat high levels of current2 inflation but potentially overtightening (raising rates too high, too fast) which could lead to ugly economic outcomes and further deterioration in financial markets. In this case, credit risk will move to the forefront within investors’ asset allocation and, specifically, fixed income portfolios.
Return of and on Principal
Unless the Fed can effectively engineer a “soft landing” (characterized by a rate hiking cycle + no recession), credit and default risk will materialize within investor portfolios. The most fiscally imbalanced (unprofitable, historical deficits), levered (highest amount of per capita debt) or economically cyclical (where revenues are sensitive to the general economic climate) types of issuers carry the highest credit/default risk.
Your traditional, high-grade municipal does not fit into these categories. A recent NASBO3 report noted that:
-
- 49 states reported fiscal 2022 general fund revenue collections exceeded enacted budget forecasts, with collections in the aggregate exceeding original projections by 20.5 percent.
- Rainy day fund balances continued to grow in fiscal 2022 after increasing 58 percent in fiscal 2021, and the median balance as a share of general fund spending is projected to be 11.9 percent in fiscal 2023.
Therefore, we believe this sector offers significant levels of safety and a high probability of the return of your principal.
Low historical default rates for municipals, as judged by Moody’s Analytics are a retrospective reflection of our belief. (See chart to the right).
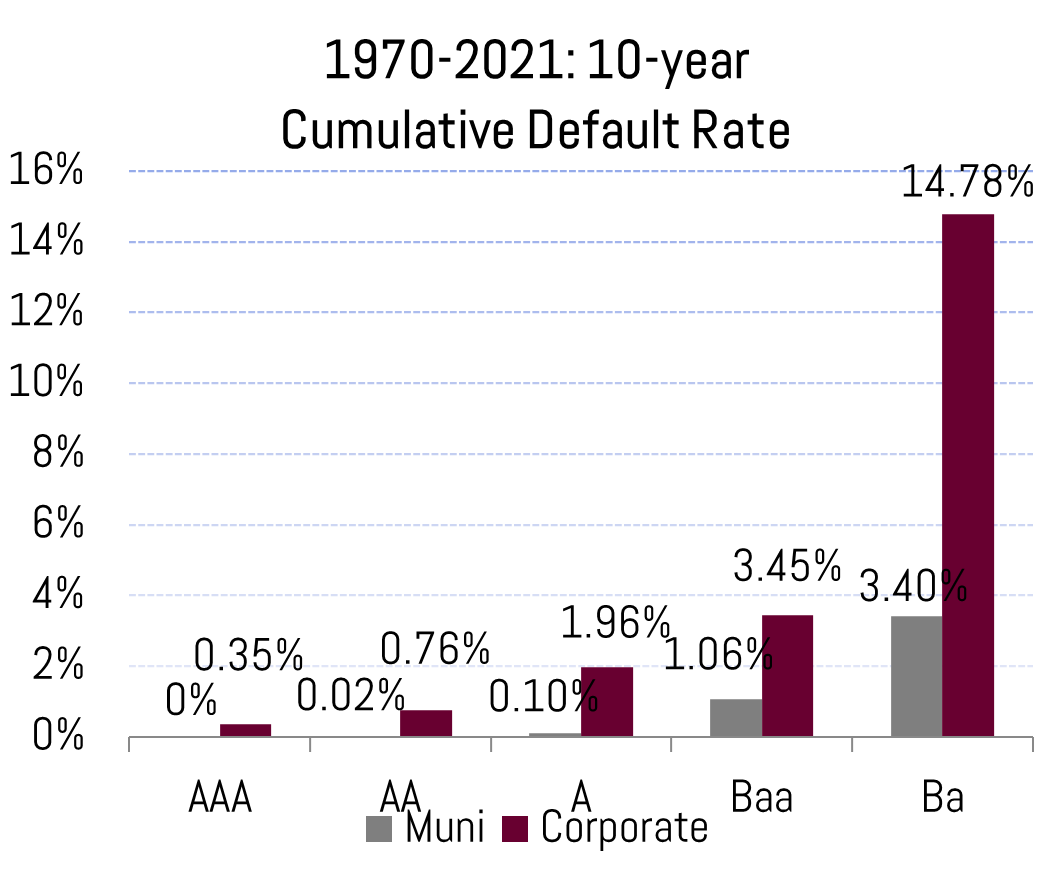
Source: Moody’s Analytics
We believe the sturdiness of municipal credit health and their ability to adjust to poor economic environments, remains in effect. Rainy day fund balances are at decade highs. And the flexibility municipalities have in raising revenue or cutting expenses is an inherent credit strength. We saw this on display during the height of the economic crisis in spring/summer of 2020.
Revenues paid to municipalities are prioritized by payers given the important underlying purposes they serve such as property taxes, electric, water, or sewer utilities. These are staple living conditions and the types of revenues that back the bonds we target.
The risk of either overtightening (Fed raising rates unnecessarily high) or sticky inflation (therefore, even higher rates) will both cause further economic deterioration. The latter case (sticky inflation) may lead us to a late 1970s, early 1980s environment of stagflation. According to the National Bureau of Economic Research, the US was in a recession twenty two of the thirty six months from 1980 to 1982.4
Where We See Value
Cash Alternatives & Short Term Strategies: For 1-2 year maturities, we are targeting a minimum of 3% tax-exempt. We are also finding readily available value in certificates of deposit, US agency, and treasury bonds.
-
- The money market funds we utilize (where the holdings have an average maturity of 30-60 days) are currently yielding 2.80% tax-exempt and up to 3.70% taxable. A 2.80% tax-exempt yield is equivalent to a 4.44% taxable yield at the 37% bracket.
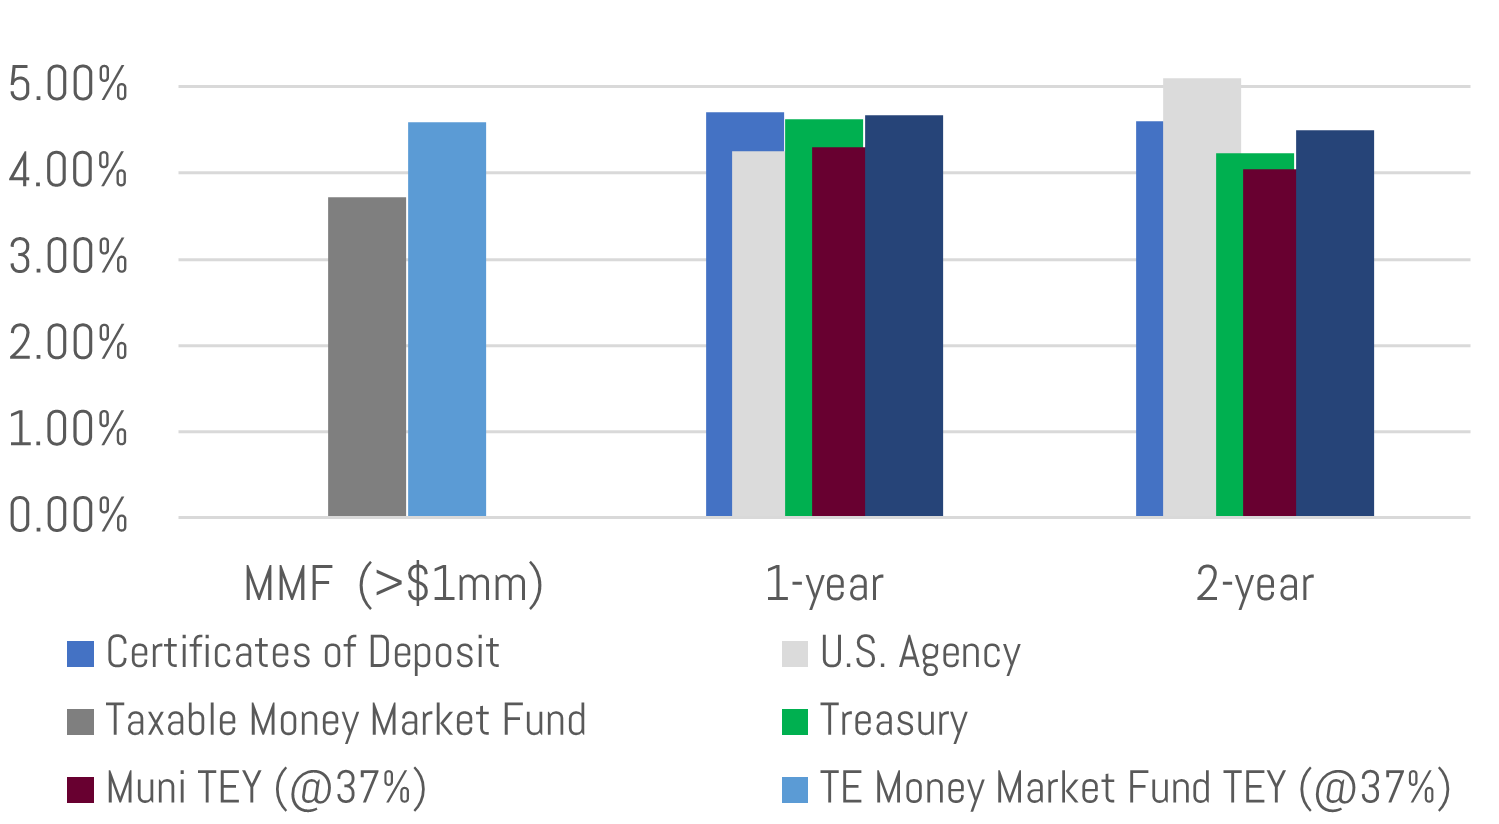
Source: Bloomberg, MMD, Bernardi Trading Desk Monday December 19, 2022
High short term rates within fixed income products are pressuring banks to raise CD rates to retain deposits. In our opinion, these higher CD rates are attractive for short term funds.
Traditional Fixed Income Strategy: Municipal yields remain nominally and relatively attractive across the bulk of the yield curve. Yields range from 3-4% tax-exempt, or 4.76%-6.34% taxable equivalent (37% bracket). Intermediate maturity ratios (the value of a municipal yield divided by the concurrent treasury) appear to be properly valued as the 10yr ratio is 72% vs. a 2-year average of 75%. The 10-year average pre-COVID, however, is in the high 80s, so a slight readjusted higher could be in store. This does not necessarily mean municipal yields are destined for higher levels (treasury yields could fall, while municipals stagnate to bring the ratio back to historical norms).
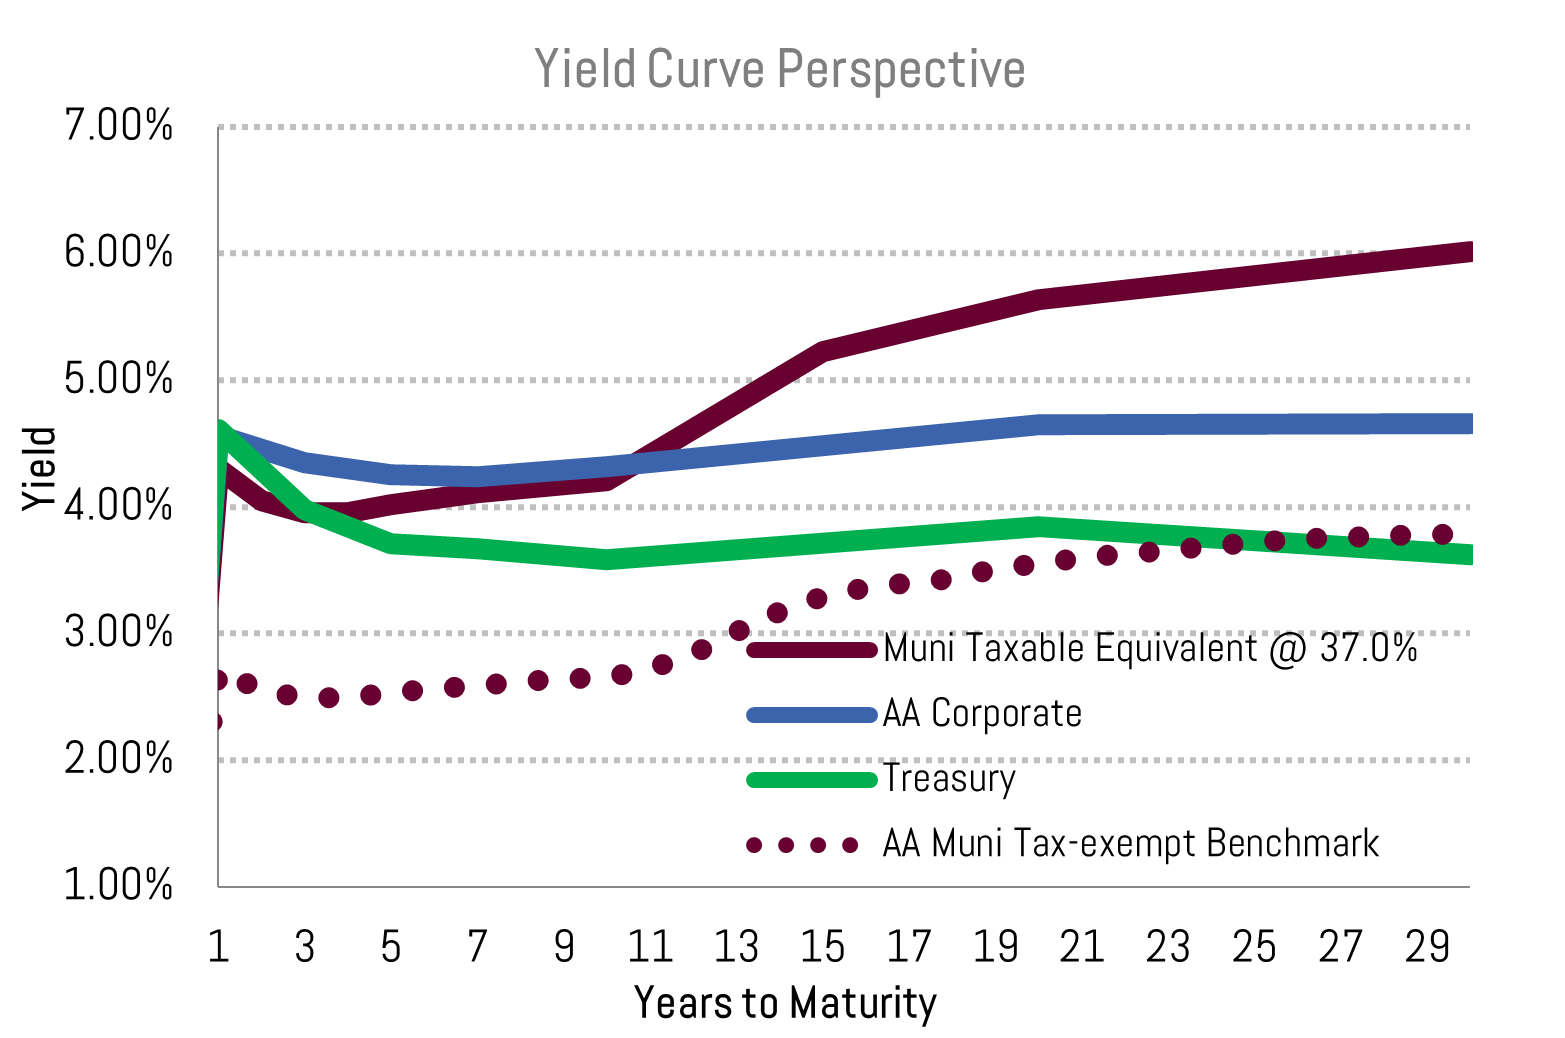
Source: Bloomberg & MMD Monday December 19, 2022
As you can see in the chart nearby, municipal taxable equivalent yields (red line) are generally more attractive than treasury and even corporate yields. Even though the latter sector, has much higher historical default rates and sensitivity to economic weakness.
The front end of the yield curve (<3 years) is a bit murkier and a toss-up day to day on what asset class makes the most sense, yield-wise. As noted above, we are targeting tax-exempt yields of 3% for short bonds (4.76% taxable equivalent at 37%), otherwise CDs, treasuries, US agency bonds make more sense.
******
In summary, we think investors need to be cognizant of the high potential for further economic weakness and, therefore, credit risk within their portfolios. We hope for the proverbial soft landing, but hope is not a good investment strategy.
Should we move on to a rockier economic climate, the best defense will be a good defense and we believe municipals are fiscally well positioned for that objective.
If further market dislocation ensues, we also believe investors are best positioned in the separately managed account (SMA) to hold those municipal assets. In addition to the benefits of customization, the SMA enables transparency and control of your assets. Control is vital in haywire markets, and something fund products oftentimes lack.
Please reach out to your investment specialist or portfolio manager if you would like to discuss your portfolio and its underlying credit health.
Thank you for your confidence in our team and have a wonderful holiday season!
Happy Holidays,
Matt Bernardi
Vice President
[1] The LEI is calculated by The Conference Board, a non-governmental organization. The value of the index is computed from ten key economic variables, such as jobless claims, building permits, and money supply. These variables have historically turned downward before a recession and upward before an expansion.
[2] For example, the real estate component of CPI is a bit of a lagging indicator reflecting current “spot” rental rates, even though there are many indications that rent levels appear to be moderating, or even decreasing.
[3] National Association of State Budget Officers, The Fiscal Survey of States, Fall 2022: https://higherlogicdownload.s3.amazonaws.com/NASBO/9d2d2db1-c943-4f1b-b750-0fca152d64c2/UploadedImages/Fiscal%20Survey/NASBO_Fall_2022_Fiscal_Survey_of_States_S.pdf
[4] https://www.nber.org/research/data/us-business-cycle-expansions-and-contractions