Please find below our portfolio management team’s Summer 2020 Municipal Market Review.

This provides an overview of current market conditions and information about municipal strategies.  If you would like additional information about our outlook, process, or specific strategies, please let us know.

Market Review – Summer 2020

Please find below our portfolio management team’s Summer 2019 Municipal Market Review.

This provides an overview of current market conditions and information about our total return and goals-based strategies.  If you would like additional information about our process or specific strategies, please let us know.

Bernardi – Market Review – Summer 2019

Below please find the our portfolio management team’s Fall 2018 Municipal Market Review.

This provides an overview of current market conditions and information about our total return and goals-based strategies.  If you would like additional information about our process or specific strategies, please let us know.
2018 Fall – Bernardi Municipal Market Review

Below please find the our portfolio management team’s Spring 2018 Municipal Market Review.

This provides an overview of current market conditions and information about our total return and goals-based strategies.  If you would like additional information about our process or specific strategies, please let us know.
2018 Spring – Bernardi Market Review

2018-02 Quarterly Market thumb.png

Please find below our portfolio management team’s 2018 Winter Municipal Market Review.

This provides an overview of current market conditions.  If you would like additional information about our process or specific strategies, please let us know

2018 Winter- Bernardi Market Review

2017FallMarketReviewBuffettquote.png

Bond yields have remained range bound over the past four months. Through the first two months of the third quarter, bonds continued their rally. The 10-year Treasury started the quarter yielding 2.31% and by 8/31 had fallen to 2.15%. Yields reversed course during the last month of the quarter with the 10-Year Treasury hitting 2.46% on 10/26. Since then, yields have fallen with the current 10-Year yield back to where it started at the beginning of the 3rd quarter at 2.32%.

Download PDF

2017-07 Quarterly Market Review FP.png
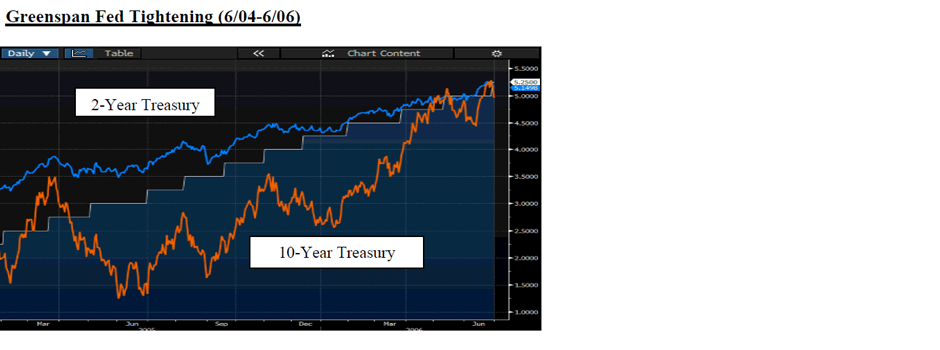
The second quarter was a wild ride for the 10-year U.S. Treasury note. The 10-year started the quarter yielding 2.35%, rose as high as 2.41% and fell as low as 2.14%. It finished the quarter at 2.31%. The 2-year U.S. Treasury dropped 14 basis points (0.14%) over the quarter, causing the yield curve to flatten by 18 basis points (see graph below). The Federal Reserve raised the Federal Funds rate by 25 basis points in June to a range of 1.00% – 1.25%. Historically, Federal Reserve tightening cycles (rising rates) are accompanied by a flattening yield curve. This once again appears to be the case.
2017 Spring Quarterly FP.png
The post-election bond market volatility that occurred during the fourth quarter of 2016 continued into the first quarter of 2017. The 10-year AAA MMD index reached a low of 2.14% on January 18th and topped out at 2.49% on March 14th. The difference between the high and low yield for the quarter looks large, however; in absolute terms the yield change over the quarter was muted as the index ended the quarter yielding 2.23%, after starting the quarter at 2.31%.
2017 Winter Quarterly FPv2.jpg

The election of Donald Trump surprised many and sent bond markets into a market frenzy. On the day before the election, the 10-year AAA rated average municipal yield was 1.73%. By the end of November, the yield jumped to 2.51%. This 78 basis points jump in yield was more than the jump in the 10-year Treasury (+53 basis points) over the same timeframe.

Download PDF

fall2016-frontpage.png
Market Update:
Fed fund futures priced in a low probability of a September rate hike and the Fed did not disappoint by holding rates steady. The municipal market saw yields drift higher for the quarter as the Fed fund futures market show an increased probability the Fed will raise rates in December. Yields on the AAA 2, 5 and 10 year parts of the yield curve increased by 21bps, 13bps and 14bps, respectively.