Historical U.S. Treasury Bond Yield Curves

Red Line = November 2003 (New, 30-yr. Treasuries were not being issued at this time)
Orange Line = November 2008
Blue Line =  November 2013 (current)
Green Line = November 2012 

Over the years, we’ve talked about the concept of the cost of waiting, most recently in 2010. What it means is that you must invest at an ever increasing yield level within the same time limit to equal what you can get if you just invest available funds at today’s rates. This becomes important if the alternative to investing funds today means sitting in a very low or even, zero-percent interest rate money market account or ultra-short bond. This is logical but it bears repeating as it looks like short-term yields are going nowhere fast. Consider the following:

Lehman Brothers filed for bankruptcy on September 15th, 2008 and the financial crisis that followed severely impacted the global economy. This spurred unprecedented actions by the Federal Reserve Bank which included taking the Fed Funds and Discount rates to near zero and also the controversial, Quantitative Easing Programs whereby the Fed has been buying longer-term Treasury and mortgage backed bonds in their attempts to hold down interest rates to coax economic growth. You can see the effects of these actions (orange line) as yields began falling in late 2008. The Fed has been rather successful but market participants have been nudging the longer rates higher over the past few months as the economy has been showing signs of strength—see the Blue Line.

As of this writing, it appears that Janet Yellen will succeed current Fed Chairman, Ben Bernanke. From her own comments we can assume that under her leadership, the Fed will maintain the easy money policy of zero-percent short rates into (or even beyond) 2016. However, it is looking more likely that the Fed will begin the process of tapering, that is, buying fewer longer-term bonds. This would likely result in a very steep yield curve with 1 to 5 year maturities essentially tethered to the zero-percent, Fed Funds rate and longer maturity bonds climbing to “normal”.

If the red line above (representing 2003) indicates where the yield curve should be once rates ultimately normalize, does this mean a spike in yields of 100 basis points or more is imminent? We experienced a rate-shock in May-June of this year on just such taper speculation.  While anything is possible, it is doubtful that this will happen as economic activity is not nearly as strong as it was in late 2003. Take a look at a few key comparisons* below:

What we feel will be the most likely scenario is that rates grind slowly upward in fits and starts with each new peak and each new valley ending at a higher point than the previous peak and valley.

If this is the course we can expect, then the logical “sweet-spot” in today’s market falls in the 7 to 12 year range. With these maturities you can expect to receive between 2.15% and 3.20% yield which captures roughly 72% of the yield of 30-year bonds, either Treasuries or AA rated municipals. Interestingly, the taxable, Treasury yields are almost identical to high-grade, tax-free yields using the AA MMD Scale for comparison—see below. When the taxable-equivalent yield is factored, the difference is striking.

What does all this mean? For investors sitting in cash or investing in short maturities waiting for rates to rise, unless you extend your ladder it is likely that you will be punished for a few more years. For investors with ladders that go longer than 12 years, stick to it, the yield curve and the ladder process is likely to reward you with increasing yields in the next few years.

Sincerely,
Jeffrey D. Irish
Vice President


* Source: Bureau of Labor Statistics & the U.S. Federal Reserve


BSI_RBernardi_Slide.jpg

“There are two kinds of people in the world, my friend: Those with a rope around the neck, and the people who have the job of doing the cutting.”

– Tuco “the Ugly” (Eli Wallach), The Good, the Bad and the Ugly, 1966

As the repeal of federal income tax-exemption of municipal bond interest continues to be a threat, let’s review talking points to share with lawmakers. These are based on thorough research and a thirty-two year career perspective of municipal bonds.

We wrap our topic around the iconic, 1966 spaghetti western film, The Good, the Bad and the Ugly, a morality play pitting good versus evil with the juxtaposition serving as a cinematic allegory for our message. The present day municipal bond market represents “the Good” — the many WASHINGTON detractors of tax-exemption do not.

A clear and present danger

As we approach year-end, the threat to municipal bond tax exemption remains a clear and present danger. As long as congressional budget disagreement persists, as long as the Congressional Budget Office, Joint Committee on Taxation, and Treasury officials claim changing tax exemption will generate significant revenue — the threat remains. And it is not removed if Congress agrees to a narrow agreement on this year’s federal budget.

It is incumbent upon state and local government officials, taxpayers and citizens benefitting from public purpose infrastructure facilities to speak loudly and clearly demanding that federal income tax-exemption be left alone.

If these collective voices go unheeded, rest assured, the financial necks of towns, cities, villages, counties, school, water, sewer and park districts across the country will be snug in a noose and, as Tuco bluntly states, other people — tax-exemption opponents — will be “doing the cutting.”

The good — since 1913

Let’s turn to our theme citing some of the positive attributes of the tax-exempt bond market:

  • Tax-exempt bonds provide state and local governments with low cost financing. Today, “AAA” rated credits with a 10-year maturity borrow at approximately 2.65%, “A” rated issues of same maturity at 3.44% and bank qualified issuers can borrow at even lower interest rates.
  • Tax-exempt bonds provide a stable, reliable platform to finance public purpose projects.
  • In 2012, more than 6600 tax-exempt issues financed over $179 billion worth of infrastructure projects, according to the National League of Cities.
  • Tax-exempt municipal bonds create jobs for local citizens.
  • Bonds build America — from roads, schools and water/sewer plants to town halls and county courts.
  • Most citizens benefit from public purpose facilities financed by tax-exempt municipal bonds — many are taxpayers, some are not.
  • Tax-exemption encourages investment in public purpose infrastructure projects. It incents wealthy investors to invest funds in our communities.
  • Tax-exemption ensures local input and control over community projects. It helps ensure financial autonomy from Washington and its origin is rooted in the doctrine of reciprocal immunity, a basic tenet of our federalist system of government.

There is much “good” in the tax-exempt bond market. Challenge those who attempt to diminish it in any substantive manner.

The bad — really not so bad

Detractors of the tax-free market cite a number of shortcomings, claiming they represent “the Bad.” Some criticism is valid, although much of it is inflated and inaccurate.

Here are the major criticisms of municipal bond tax exemption and brief explanations debunking the alleged shortcomings:

  • “Significant cost to U.S. Treasury per Joint Committee of Taxation (JCT) studies.” Without question, the Treasury loses tax revenue because of tax-exemption. This is true about almost all tax expenditures and not unique to tax exemption. But blindly accepting JCT or Treasury calculations as the starting point of any discussion without questioning their accuracy distorts the issue. As the nearby chart shows, federal government calculations places tax exemption far down the list.

    Source:  Office of Tax Analysis in the Department of the Treasury and The Joint Committee on Taxation.


  • More importantly, the methodology used to calculate cost or Treasury’s foregone revenue is deeply flawed. It is fundamentally inaccurate because it relies on simplistic assumptions. One example: certain government methodology assumes investors will reinvest 100% of tax-free bond investment dollars into taxable bonds if repeal occurs resulting in significant additional taxes flowing into Treasury. This assumption is way off the mark and greatly overstates the cost of tax exemption. Many, likely most, investors will change their behavior if tax exemption is repealed or substantively reduced. Many will choose not to reinvest 100% of their current tax-free dollars into the taxable bond market if changes occur. Therefore, the figure cited in certain government’s tables is illusory and trumpeting this “cost” number in the halls of congress is terribly misleading. Our December 2011 white paper, Tax Exempt Municipal Bonds: The Case for an Efficient, Low Cost, Job Creating Tax Expenditure discusses this issue in great detail. The report cites several academic studies that challenge federal government calculations. Professors’ Poterba and Verdugo study illustrates the sensitivity of JCT revenue estimates for eliminating the interest tax-exemption to various alternative portfolio adjustments investors will make if tax exemption is changed. The bottom line of the report — the government’s revenue gain is on average almost 65% lower than JCT calculations.
  • “The wealthy benefit disproportionally from tax-exemption.” Tax expenditures are adopted to encourage individuals and businesses to participate in activities they would not participate in absent the tax inducement. That is the point of the tax expenditure. Tax exemption incents people to invest in our nation’s public purpose projects. Investors lend at low interest rates because income earned is not subject to federal income taxes. And it is not only the top “one percent” investing in our nation’s infrastructure. In 2010, per IRS data, approximately 3.3 million tax filers earning $100,000 or less invested in tax-free bonds with 50% of this group earning $50,000 or less.
  • “The federal subsidy inherent in tax exemption is inefficiently distributed.” Critics cite the existence of a “clearing rate” as evidence of significant market inefficiency. They claim it unfairly allocates a portion of the subsidy to top tax bracket investors rather than going to state and local governments. The clearing rate concept is generally described as the incremental increase in yield the issuer must pay on its bonds in order for the entire issue to be sold or “cleared.” Critics claim since not all investors in this market are at the top income tax bracket, an issuer pays some additional yield premium to make the bonds more attractive in an effort to induce lower bracket investors to buy the last remaining portion of an issue. This results in top tax bracket investors earning incrementally more yield than would have been otherwise demanded. This is viewed as windfall income by opponents of tax exemption. They claim it reduces the federal subsidy going to issuers and instead is a “freebie” to the wealthy.

Clearly, there are inefficiencies in the market. All markets exhibit certain inefficiencies so this is not a phenomenon unique to the tax-exempt market. But the critic’s “inefficiency” charge is overstated on several levels. It ignores obvious differences between municipal bond market dynamics and the comparable corporate market model federal government officials use to conclude top taxpayers are earning windfall income. Once again, some of the underlying assumptions relied on are wrong — making the model comparison invalid. There are significant differences between the municipal and corporate bond markets: call feature optionality, diversity and sheer number of different issuers, average maturity per issue, average trading block size, and real and perceived credit metric differences to name a few. These are all contributing factors determining the final yield level of a tax-exempt issue. The clearing rate of a typical issue results from the municipal bond market’s inherently idiosyncratic nature.

We all recall the short-lived Build America Bond (BAB) program. According to Treasury, a primary, positive feature of the program was its heightened efficiency. Treasury claimed more of the federal subsidy flowed to the issuer rather than wealthy investors in the form of the clearing rate effect than is the case with the tax-exempt market.

A comprehensive report published by the Swiss Finance Institute debunks this claim and shows the BAB program was rife with pricing inefficiencies. A clearing rate issue clearly existed in this market as well even though few top tax bracket investors bought BAB issues. Why? Because taxable investors recognize the same idiosyncratic features unique to the municipal bond market and demand higher yields to induce them to invest. The clearing rate issue present in today’s tax-exempt market does not represent a significant windfall yield freebie to top tax payers as government officials claim. It results from investors demanding higher yields to offset idiosyncrasies of the municipal bond market place.

The good attributes of the tax-exempt market far outweigh the so-called bad ones. Challenge those who attempt to diminish it in any substantive manner.

The ugly — really ugly

If tax exemption is repealed or substantively altered, market participants will adapt and adjust. Local governments will continue to need capital for projects. Bernardi Securities, Inc. will continue to assist state, local governments and investors as we have done for decades. We are experts in the field and the need for municipal bond market expertise will not disappear.

State and local governments — and most of their citizens — however, will face many difficult choices if tax exemption is repealed or substantively reduced. Here’s why:

  • Increased financing costs for local infrastructure projects. On February 6, 2013, Ann Arbor, MI came to market with a taxable and tax-exempt issue both rated AA+. The 2023 maturities yielded 2.50% and 2.0% respectively. In other words, Ann Arbor’s taxable borrowing rate for the 10-year taxable loan is 25% higher than its tax-exempt borrowing costs for the same time period. That is a significant incremental cost that will affect almost everyone living in Ann Arbor. The cost differentials for other time periods were not as extreme as the 10-year spot, but still notable. Compared to Ann Arbor, we would expect less frequent and lower credit quality issuers to experience larger borrowing cost differentials.
  • Higher local taxes and user fees. Capital needs of state and local governments will not disappear if current tax exemption is repealed, partially taxed or replaced with taxable market. Local residents will see tax and fee increases to cover higher financing costs.
  • Reduced project scope, outright cancellation in some cases. Reluctance or inability to increase local taxes or fees to cover increased financing costs will lead to scaled back projects or cancellation.
  • A less efficient market with loss of local autonomy in decision making and more federal oversight. Some tax-exemption detractors seek to replace the tax-exempt market with tax credits. This is a time-tested idea that is a proven failure. The market is thin and terribly inefficient and has been for the more than 30 years I have been in this business. It would be a colossal mistake to attempt to replace the current market with a tax credit alternative. The BAB program offered a tax credit option choice and there was a near complete lack of interest from both issuers and investors. Approximately $200 billion of BAB issuance occurred with the tax credit component comprising less than one percent. One reason is lack of trust by investors and issuers that the federal government will honor any commitments long term. Why should issuers and investors be assured the federal government will not renege on its tax credit commitment in the years ahead given its failure to honor its BAB subsidy commitment to state and local governments — a program that just ended a few years ago?
  • Diminished, if not complete loss, of local decision making power over community infrastructure projects. Tax exemption helps ensure local decision making surrounding infrastructure projects. Tax exemption is not just another special interest tax expenditure like the mortgage interest, earned income tax credit or defined benefit plan deductions. Tax-exemption was codified into law as part of the Revenue Act of 1913. The aforementioned tax expenditures did not receive this distinction, in part, because lawmakers wanted to help ensure the doctrine of reciprocal immunity for state and local governments (“the power to tax involves the power to destroy”) — a basic tenet on which our federalist system of government is founded. Tax exemption helps ensure this doctrine. Repeal it, substantively reduce it and Washington bureaucrats will have an even greater say in decisions surrounding your local school building project, village hall expansion, city water plant upgrade, community recreation facility or county courthouse project. The list is long and will affect nearly everyone.

Tax exemption call to action

“I’ll keep the money and you can have the rope.”

– Blondie “the Good” (Clint Eastwood) to Tuco, The Good, the Bad and the Ugly, 1966

The goal is for state and local governments to “keep the money” — the unencumbered right to issue tax-exempt bonds to build public purpose projects. This is what needs to be done. Speak up and speak out.

Ask lawmakers to enact sensible improvements that will strengthen the current tax-exempt market. Here are a few of our thoughts:

  • Insist that Congress positively assert tax exemption for public purpose infrastructure projects is sacrosanct. Remove the threat of repeal or idea of capping its value at an arbitrary 28% level. Absolute clarity on this issue will reduce uncertainty, market volatility and improve market efficiency. Greater certainty lowers borrowing costs for communities. That is good for all.
  • Refine the scope of “public purpose infrastructure projects” as the current universe of valid tax-exempt projects is too broad. Doing so will reduce the new issue supply. Market efficiency will improve, borrowing costs for communities across the country will decline and Treasury will receive increased revenue. Each year there are many new non-public purpose projects that receive a tax-exempt subsidy. The number of these types of tax-exempt projects should be reduced requiring them to come to market as taxable loans.
  • A modified Build America Bond program for public purpose projects should be reinstated. In spite of the severe damage sequestration has had on the view many have of the program, state and local governments and their citizens may benefit from a modified version. Such a program would provide state and local governments with an alternate financing option when the tax-exempt market becomes too volatile and costly, as was the case in late 2008 and 2009. The program would offer a reduced federal subsidy of 20-25% and serve as a market governor of sorts. Issuers would rely on BAB issuance to raise funds if and when the traditional tax-free market became too costly. Placing a limit on the amount of issuance would help limit program issuance abuse.
  • Increase “bank qualified” issue size allowance
  • Improve issuer disclosure practices. Our 2011 Tax-Exempt Municipal Bonds white paper suggested that implementing standardized required reporting mechanisms and universal recognition by issuers of the importance of compliance would greatly enhance our marketplace. We discussed municipal disclosure improvements in some detail during our recent Public Finance Roundtable, as well as the public finance panel discussion I moderated at the 2013 Bond Dealers of America National Fixed Income Conference. The latter conversation also covered the threat to municipal bond tax exemption.

Before discarding or severely limiting tax-exemption there needs to be a discussion about what it has accomplished over the last century and how it is interwoven into the political and economic fabric of our society. It is important for all citizens to help shape this debate. It should not be controlled by a handful of federal policy makers and congressional staffers removed from the reality of running local government and removed from living in our communities. The discussion should be led by state and local officials from across the country who understand what it takes to run local government. It should be shaped by citizens who pay taxes, by citizens who use and benefit from public purpose facilities financed by tax-exempt bonds.

For all of its shortcomings, the tax-exempt public finance market is envied around the world. It is efficient and reliable. State and local governments have relied on it for 100 years to raise capital to build our nation’s infrastructure.

If we believe in the principles of federalism embodied in the Constitution, if we believe state and local governments should have wide latitude to independently finance public purpose infrastructure projects their citizens need, want and are willing to pay for — then radical changes to the present day municipal bond market should not occur. Substantively changing the market will affect all of us in a significant way.

Ronald P. Bernardi
President and CEO
Bernardi Securities, Inc.
December 4, 2013

Last month was a turbulent experience for the Treasury markets, though municipals have been able to sustain a relative rally. The catalyst to each ebb and flow of last month’s bond market has left our purview as the debt ceiling crisis and brinksmanship in D.C. rattle markets today. However, as bond market investors, we cannot lose sight of last month’s market influences and how they may impact us in the future.

Municipals outperformed Treasuries

The 10-year Treasury note rose above 3% early in the morning of September 6th. At that point it was already up 0.22% in yield for the month and up 1.25% in yield year-to-date. As of October 10th, the 10-year Treasury has round-tripped and more, coming back down to 2.71%. The cause for the bond market rally began with Larry Summers withdrawing his name for consideration for Fed chair – as he was perceived as anti-QE – and then was considerably augmented after the Fed decided against tapering during their September FOMC meeting. On that very day the 10-year Treasury dropped from 2.86% to 2.68%. The municipal market displayed less volatility and generally outperformed Treasuries during September. The 10-year municipal/Treasury yield ratio began the month at 110% and is currently at 103% (i.e. municipal yields were 110% of the 10-year Treasury). Although municipal bonds outperformed Treasuries in September, yields are still at higher nominal rates before factoring in the effective value of the federal income tax exemption.

Fed misinterpretation & lingering volatility

Why such turbulence? There are numerous reasons, of course. A major contributing factor is investor misinterpretation of Federal Reserve communications related to its monthly purchases of mortgages and bonds. From inception, the Fed communicated to investors its policy would be “data-dependent”. However, the market inferred from Fed commentary over the last several months that it was comfortable enough with economic data to begin to taper these monthly purchases. Those expectations contributed greatly to the 10-year Treasury bond rising to 3% in early September. When the FOMC released their statement on September 18th it became apparent to readers that tapering would not occur in September, leading to this month’s rally.

Until the Fed is comfortable with the underlying economic strength – both job creation and price stability – we expect their unconventional policies will continue. Expect volatility to linger as well.

As always, please call us if you have any questions or would like us to help you review your portfolio.

Sincerely,

Matt Bernardi
Bernardi Securities, Inc.
October 10, 2013

The Bernardi Securities August 2013 market commentary written by Scott Rausch, Outperforming the Madness of Municipal Bond Fund Herds, was mentioned in an August 30, 2013 blog post on MarketWatch as a market professional perspective on mitigating the consequences of bond fund outflows. 

Read blog post >


As many of you know, certain contractual agreements entered into under SEC Rule 15c2-12 (the “Rule”) require ongoing disclosures by municipal securities issuers. These disclosures may include financial information, operational information and event notices disclosing the occurrence of specific events that may have an impact on an issuer’s outstanding bonds. These disclosures are to be provided to the Municipal Securities Rulemaking Board (“MSRB”), and more specifically MSRB’s Electronic Municipal Market Access (“EMMA”) website.

These continuing disclosure requirements can be confusing and in  response to municipal issuers’ requests the MSRB released additional guidance and tools to help issuers file correct and timely disclosures to the EMMA website.

We thought it would be helpful to you and your colleagues to forward the recently released MSRB continuing disclosure guide providing issuers with a road map of their obligations under the Rule.  The guide provides issuers with a detailed breakdown of the steps that should be followed to submit bond documents, annual financial statements and other necessary disclosures to EMMA, as well as cites numerous federal enforcement actions in which issuers sometimes failed to file the required information.

The MSRB also launched a new email reminder tool to help issuers submit timely disclosures to the EMMA website.  The  tool alerts the issuer of approaching due dates for annual or quarterly financial disclosures to EMMA.  Scheduling email reminders on the EMMA website can help ensure timely filing of the issuer’s annual financial information and audited financial statements.  Up to three email addresses can be included to schedule a reminder, which ensures that anyone with a role in preparing and filing financial disclosures is advised of upcoming filing deadlines.  Learn more about the email reminder tool and read the instructions for scheduling and managing email reminders.

Our entire public finance team is available to assist you and answer any questions you may have regarding these applications.  Please call us if you need some assistance.

Recent Actions against Issuers

The MSRB Guide to Disclosures was released in part, due to SEC actions against Harrisburg, Pa. and West Clark Community Schools in Clark County, Indiana as well as charges against the State of Illinois over faulty pension liability disclosure.  In each of these cases, the SEC investigation found that these issuers were not in compliance with the continuing disclosure agreements.

Harrisburg had a major financial liability due to an incinerator financing and the SEC charged the city for failing to stay current on its continuing disclosure documents, while simultaneously telling the market misleading information in speeches and other materials. The Clark Community School District in Indiana, and its underwriter, were charged with falsely claiming the issuer was complying with continuing disclosure obligations.

The SEC action against the State of Illinois was in part due to the State’s failures to properly “disclose that its statutory plan significantly underfunded the state’s pension obligations.”  According to a March 13th Wall Street Journal editorial, “it’s now official: The Land of Lincoln has the nation’s most reckless and dishonest state government when it comes to pension liabilities”; the state’s “accounting practices would get private market participants thrown in jail.”

Departing SEC commissioner and former chairman, Elise Walter, who was a strong advocate for increased municipal transparency, said issuers and transaction participants should now understand that the SEC is serious about muni enforcement.  “We’ve come a very long way in the last five years from people who asked me for safe harbors from anti-fraud provisions, so that there were things that people could say and never be subject to fraud for it, which I found astounding as a request,” she said.  There has been a growing “understanding that this is a securities market and it is subject to securities market rules.”

Future Enforcement

Walter recently stated that the bottom line is municipal market participants who rely on continuing disclosure data get cheated if municipal issuers are not living up to their disclosure agreements.  “There are a lot of people out there who are not following through on what they are contracted to do,” she said.  The important part of that is what underlies it, which means issuers should be not allowed to avoid disclosing current information and then, when they are preparing to do another bond deal, say, “Oh, whoops! I’ll bring it up to date!”  “You should not be able to engage in that kind of behavior and it’s not right that investors in those municipal bonds have no current information,” Ms. Walters said.

As Walter departs the commission, there remain challenges on various regulatory levels.  Walter said she has no regrets, but wishes she could have achieved more, especially the legislation called for by a muni market report, which was prepared by the SEC last year and supported by all of its commissioners.  One recommendation in the report was for Congress to give the SEC the authority to dictate the timing and content of issuer’s secondary market disclosures.  While that legislation has not passed, there is traction for additional legislation on the federal level which will make it more difficult and/or costly for municipal issuers to come to market with a new bond issuance if they have not been timely on prior continuing disclosure requirements.

Detroit

Even though the SEC has no jurisdiction over bankruptcy proceedings, they have stated that they are keeping an eye on the City of Detroit and its bankruptcy filing.  The City’s emergency manager, Kevyn Orr, is attempting to treat general obligation bondholders as holders of unsecured debt and offering them pennies on the dollar for their investments.  SEC muni chief John Cross has stated that Detroit’s situation in part illustrates the magnitude of pension liability disclosure issues, which is something the SEC will continue to monitor from an enforcement standpoint.

“If you look at the Detroit bankruptcy that just occurred, something like $3.5 billion in direct pension liabilities and another $6.5 billion in health care post-employment liabilities,” Cross said.  “Almost half of their total $19 billion in exposure is related to those topics.  That’s not to say that’s what Detroit’s problem is, but it is illustrative of the magnitude of that issue, potentially.”

Walter said the Detroit issue could represent a wider disclosure problem if investors in general obligation bonds believe the pledge behind those bonds is much stronger than secured revenue backed bonds and issuers that don’t follow through with their commitments when they are under fiscal stress. “There can very well be disclosure implications among other things depending on what happens there, because people need to know what they’re buying,” she said.

For additional information regarding Continuing Disclosures and issuer’s responsibilities as well as a list of these disclosures and material event notices, please click here.

There are continual changes in municipal disclosure legislation and requirements. We will continue to lead in this area and as changes occur, we will do our best to keep you apprised.    Please feel free to contact me or any other public finance banker of our firm with any questions.

Thank you for your continued confidence.

Sincerely

Robert Vail

Vice President & Director of Public Finance

Bernardi Securities, Inc.

September 9, 2013


BSI_Herds2.jpg

Men, it has been well said, think in herds; it will be seen that they go mad in herds, while they only recover their senses slowly, and one by one [i]

— Charles Mackay

It can be said that relative portfolio outperformance – and the overall security of principal – is in many ways dependent on the avoidance of investing or divesting with the herd. Mackay’s words from his famous work Extraordinary Popular Delusions and the Madness of Crowds serve as an important lesson to avoid irrational herd-like moves. As we have learned over the last decade, only hindsight is 20/20 when it comes to pinpointing irrational valuations. The avoidance of herd-like situations is precisely why separately managed municipal bond portfolios offer an advantage to bond mutual funds or ETFs.

Separately managed account control

A separately managed bond account allows for greater control and is less subject to the fears of other investors in terms of mass redemptions. In the rising rate, headline risk environment we are experiencing today, this is a vital defense mechanism of a separately managed portfolio. The ability to select and also remove individual bonds from your account gives you the advantage of choice. Consequently, you neither need to invest nor sell with the herd.

According to the Investment Company Institute[ii] we have experienced 13 straight weeks of outflows from municipal bond mutual funds, amounting to a total of $35.3 billion. Total bond fund outflows (taxable and tax-exempt) over this period have amounted to just over $98.4 billion. The move in interest rates have corroborated fund flows over this time period, as the 10-year Treasury has jumped to 2.76% from 2.11% while the MMA 10-year “AAA” municipal index has increased to 3.07% from 2.22%.[iii]

Mitigating the consequences of fund outflows

The last time such a significant outflow from municipal bond funds occurred was at the end of 2010, when Meredith Whitney called attention to the strained fiscal situations and sometimes inadequate disclosures within the municipal market. From December 2010 until April of the next year, municipal fund outflows totaled $35.4 billion. The bond market was able to reverse this sell-off weeks later once investors realized the overblown nature of her prediction, but by then, the damage had been done.All bond investors – no matter what investment strategy they use – experience paper losses in their bond portfolios when the above mentioned sizeable fund outflows occur. When selling supply significantly outweighs demand, bond prices become depressed and bond yields often rise substantially. This is an immutable law of bond finance, if you will.

However, owning individual bonds in a separate account enables flexibility to both avoid and mitigate certain aspects of this market paradigm. For one, usually bond funds do not have a maturity date and there is no guarantee they will return to their original value. Barring default, individual bonds return principal at maturity, and as their maturity date approaches, their intrinsic value naturally moves to a par ($100) price. Additionally, individual investors within bond funds are not able to customize their tax-loss harvesting by offsetting capital gains with losses taken on specific bonds.

The cost of big bond fund redemptions

Most mutual funds maintain a small cash cushion in order to mitigate the pricing impact from routine liquidation levels from investors. They do not maintain a cushion to satisfy massive redemptions as they have experienced in recent weeks. Therefore, they must sell a portion of fund holdings in order to raise cash to meet redemptions. This is putting additional pressure on an already tense market; as noted, the footing of the municipal market is weaker today than it was in late 2010 due to a more volatile backdrop of escalating rates paired with headline risk arising from the Detroit bankruptcy petition and other stressed municipal credits.

As an example, the iShares MUB, the largest ETF that tracks the municipal market, currently sells for LESS than its component holdings – individual municipal bonds – due to the selling pressure of individual investors. The ETF currently trades at a 0.96% discount to its net asset value (NAV) versus a 0.31% average premium since 2007.[iv] Basically investors are trading this ETF at a value less than where the individual component bonds are priced. Thus, if an investor needed to liquidate a portion of their position in MUB, they would be hit with an immediate 0.96% discount, thanks to the herd’s move. In late June, this discount was as large as 2.85% – larger than many of today’s coupon payment rates.

This pricing anomaly probably will reverse itself at some point in the future. Time will tell. In the meantime, it should serve as a good lesson as one of the perils of investing with the municipal bond herd.

As always, please call us if you would like to review your municipal bond portfolio or if you have any questions.

Scott R. Rausch, CFA
Portfolio Manager
Bernardi Securities, Inc.
August 28, 2013
 

_______________________________

[i] MacKay, Charles (1980). Extraordinary Popular Delusions and the Madness of Crowds (with a foreword by Andrew Tobias, 1841). New York: Harmony Books
[ii]http://www.ici.org/research/stats/flows. The Investment Company Institute is the national association of U.S. investment companies, including mutual funds, closed-end funds, exchange-traded funds (ETFs) and unit investment trusts (UITs). Members of ICI manage total assets of $15.3 trillion and serve more than 90 million shareholders
[iii] Source: Bloomberg
[iv] Source: Bloomberg

 
BSI_RBernardi_Slide.jpg

The bond market experienced sharp, rapid adjustment in the second quarter — arguably the greatest since the fall of 2008. The 10-year Treasury bond yielded 1.63% in early May and finished June yielding 2.49%. As of June 28, year-to-date it had lost 2.57% of its value.

The 10-year, “AAA” rated Municipal Market Data (MMD) municipal bond index reacted similarly during this two-month period ending June with a yield of 2.56% compared to 1.90% as of May 28. The recent rise in bond yields translate into significant price declines sparing few, if any, bond investors. For some, forced to sell during the tumult, it was a bloodbath reminiscent of Q4 2008 and Q1 2009.

The Great Rotation debate 

Certain pundits claim the increasing bond yields of the last few months mark the beginning of the “Great Rotation” from bonds into equities and record amounts of cash coming off the sidelines. No one can be certain at this point if the cycle has turned. It is too early to tell in our view as we keep in mind several times post Q3 2008 when Treasury bond yields increased by 50-60 basis points only to subsequently see bond prices rally and yields fall. Certainly we are wary bond investors, but we have seen this before.

A case can be made perhaps that the recent bond sell-off presents a short-term, attractive buying opportunity. Some of the best investments we made for our clients in recent years occurred when we invested client cash in the last quarter of 2008, the first quarter of 2009 and in 2010 following the airing of the well-known “60 Minutes” municipal bond market segment. If the Fed does not sell in quantity, prices will stop falling and may reverse their recent trend. 

Separate account, laddered portfolios vs. municipal bond funds

Almost universally, our client’s separate account, laddered portfolios handled last quarter’s turmoil much better than the broader bond market. This is a similar storyline to what our clients’ portfolios experienced during the 2008-2009 financial crises. These portfolios avoided much of the damage resulting from the panicked selling of many bond funds, bond ETFs and hedge funds. In contrast, the June experience of many bond fund and ETF investors was bad. Fund investors unloaded shares at a record pace — $6 billion worth in two weeks — forcing some funds to sell bond holdings to dealers at a time when prices were plummeting. These funds recorded significant losses.

One thing we know with certainty after three decades specializing in this business: it is difficult to hedge or effectively short the municipal market and when municipal bond funds are forced en masse to sell bonds to meet redemptions, losses for shareholders are magnified. For example, the iShares S&P National AMT- Free Muni Bond (MUB) lost 1.76% in value in ONE week (June 13-20) and the Pimco Total Return Fund lost 2.59% in June. Certain “inflation protected” funds lost more than 6% of their value in the second quarter. Many investors learned in June share sale prices can veer significantly from NAV in a market rout because the funds’ advertised liquidity feature tends to disappear. 

Here is an excerpt from our November 2008 market update

“This financial crisis has reinforced in our minds the significant advantage enjoyed by investors who use a SEPARATELY MANAGED, NON LEVERAGED bond portfolio strategy. This approach to bond investing lessens your volatility and increases your liquidity……..Among other things, separate account management allows for quality investments to be held when the market moves sharply downward. There are no forced sales in a separately managed bond portfolio unlike what often occurs in bond funds when prices plummet. When the general market recovers, so does the paper value of your investment………Additionally, if you need to raise capital you simply request bids for a portion of the bond portfolio; even in this market, you will find bidders for smaller blocks of quality, shorter maturity, fixed rate bond issues. This simple strategy has worked well for decades and we expect that won’t change anytime soon.”

We are not downplaying the reality that separate account portfolios lost value over the past two months. We remind you investing in the bond market entails risk, which can result in losses.

Importantly, recently incurred portfolio paper losses for the most part will be offset over time as income and maturity proceeds are reinvested into higher yielding bonds. For income-oriented investors, adhering to a disciplined strategy of investing in quality bonds laddered over an intermediate time frame remains the soundest way to invest in the municipal bond market. 

Separate account, laddered portfolios vs. money markets

We have had many conversations recently with concerned clients about the recent decline in portfolio valuations. Some fear what will happen if interest rates continue to rise and bond prices decline further. Some have asked, “Would I be better off selling my bonds and just holding cash until bond prices stop falling?” After all, as yields increase, the yield on cash should grow in tandem, while existing bond prices would decline in value as yields rise. This would lead one to reasonably wonder if a simple money market fund investment would outperform a fixed maturity, laddered bond portfolio. One of our portfolio managers, Scott Rausch, CFA, recently prepared a couple of scenario analyses that look at this very issue.

The first is a simplified scenario consisting of a $1.2 million, equally laddered municipal bond portfolio spread over six years (i.e. $200,000 par maturing in each year). Bond quality is split 40% to 60% between “AAA” and “A” rated bonds, respectively, and initial yields are based off of actual Municipal Market Data (MMD) levels for bonds settling August 1st of this year. This portfolio is compared to a tax-exempt money market fund, which currently yields zero percent. 

These portfolios were then exposed to a 100 basis point increase in interest rates, applied to all maturity dates, at the end of each twelve-month period. Maturing bonds and income from the bond portfolio were rolled over at the new, higher six-year rate each year. 
Even in this extreme rising rate environment, the bond portfolio only trails the performance of the money market fund by 26 basis points on an annualized basis (2.23% for the bonds versus 2.49% for all cash). However, tax-exempt income for the bond portfolio is greater — $217,248 versus the money market’s income of $190,473. The laddered portfolio delivers higher income. 

This is an interesting exercise in bond math, but a six-year run of yearly 100 basis point rate increases across the entire yield curve is unlikely to actually occur. Thus, we looked at recent history for a more realistic scenario, and focused on the period from June 2003 to June 2009.

The burst Internet stock bubble fed into a recession that started in March 2001, and was exacerbated by the economic shock resulting from the September 11th attacks. In reaction, the Federal Reserve embarked on a series of cuts in the Federal funds rate, reaching a then unheard-of 1.00% in June 2003. As the economy improved, the Fed gradually raised short-term interest rates over a two-year period from 2004 to 2006. This rate then stabilized for 15 months, and dropped precipitously over the next 15 months.  
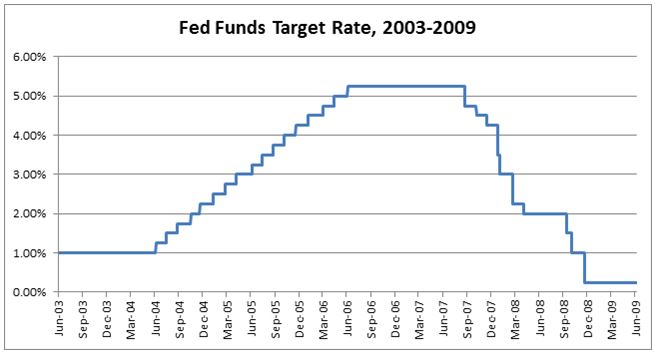
 

We used municipal bond yield data from this period to create a $1 million tax-exempt portfolio. The model portfolio has $200,000 par value maturing each June over a five-year ladder. Our kickoff date is June 2003, when the Fed funds rate bottomed out. Each June, maturing bonds and all income are reinvested at the new five-year bond yield. The model assumes a 40% to 60% weighting of “AAA” rated and “A-“ rated general obligation bonds, respectively. Spot bond yields for our 2003 kickoff and each succeeding year are based directly on the Bloomberg fair market curve indexes for the relevant maturity dates. The results of the tax-exempt money market fund are based on actual returns of the Vanguard Tax-Exempt Money Market Fund during this period. Here are the results:
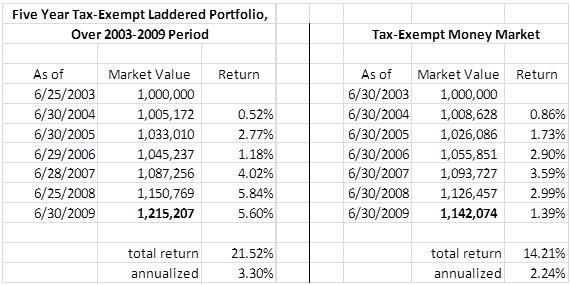
  

As you can see, the laddered bond portfolio lags behind the money market fund in two of the first three years, but as each tranche of the bond portfolio matures, the proceeds and all interest are reinvested at the new five-year yield. In all years over the actual five-year reinvestment period, the $200,000 par value maturity proceeds are reinvested at higher rates than that tranche’s original yield. 

As an example, three years into this model as June 2006 arrives, the $200,000 that had been producing cash flow at a 1.66% yield is reinvested in June 2011 bonds yielding 4.10%. This is a 244 basis point increase. As you can see, as time progresses the laddered portfolio outperforms, as more and more of its assets are locked into higher yielding bonds.

The outperformance of the laddered bond portfolio, in part, reflects the power of compounding interest from higher yielding bonds found at different points of the historically upward-sloping yield curve. This dynamic helps to cushion the lesser paper value of some bonds held at lower yields. Additionally, any unrealized paper losses on lower yielding securities diminish as maturity approaches, becoming zero at payoff.

The average U.S. economic expansion lasts three and one quarter years, per the National Bureau of Economic Research. Eventually, interest rates and bond yields decline, as they have always done. When this begins to occur, the higher yields captured in the laddered portfolio will significantly outperform cash.

Finally, the tax-exempt income for the bond portfolio is $177,377 — versus the money market’s income of $142,074. The laddered portfolio delivers higher income and higher total return.

Opportunistic investing in imperfect markets

This brings us to a critical point — our model does not take into account any sort of competent, active management. It makes no allowance for opportunistically capitalizing on market mispricings, or for superior credit analysis, or for any other value-added feature of our bond portfolio research and management process. The municipal bond market is, by its vast and disparate nature, inherently less efficient than the U.S. Treasury or high-grade corporate markets. Our clients’ portfolios benefit from this dynamic.

Our analysis also excludes the issue of tax loss harvesting swaps by which the bond manager takes losses in carefully selected, lower coupon bonds so that the client can shield income from another source. Sales proceeds can then be invested at new, higher-yielding tax-exempt securities. This can benefit investors seeking maximum tax efficiency and the further enhancement of portfolio returns.

For income oriented investors with a mid- or long-term perspective, we see a notable benefit to rapidly rising yields and an imperfect market — the opportunity to take advantage of heavy selling by bond fund and ETF managers who are forced to sell bonds to meet the redemptions of panicked investors. We have seen this many times over several decades managing bond portfolios. We recently saw this in June, as multiple investors tried to sell similar bond holdings at the same time, with sellers greatly outnumbering buyers, leading to a significant decline in prices.

When these markets occur, we try to avoid selling and try mightily to add quality credits at attractive yields to client portfolios. We did this two months ago. We did this in 2010. We did this in 2008-2009. And we will do it again in the years ahead.

Periods when bond prices drop significantly and yields increase in a short period of time present wonderful investment opportunities for a committed fixed income investor.

This is not the end

The market events of the past few months give us a glimpse into our bond market future. It has been quite a stretch, no doubt, and we expect more future volatility.

Today, market liquidity is more tenuous than in past years. This is the result of dealers holding less inventory, increasing regulatory requirements, a smaller investor base and more retail ownership through mutual funds and ETFs rather than direct holdings. This liquidity dynamic may cause problems and anxiety for ephemeral bond investors. For committed investors with separate account management, laddered portfolios this dynamic are less problematical. In fact, a market like we are currently experiencing can offer wonderful investment opportunities. 

A silver lining in June’s storm cloud: when a bond investor is selling at distressed prices there usually is another investor buying. Expect more price volatility and remember that volatility often brings opportunity.

The current state of the bond market reminds me of Sir Winston Churchill’s observation in November of 1942, “Now this is not the end. It is not even the beginning of the end. But it is, perhaps, the end of the beginning.”

Opportunity in muniland — remembering, why bonds?

We believe last quarter’s disorderly secondary market with its diminished level of liquidity portends one bit of good news for income oriented bond investors: higher nominal and relative yields and therefore better incomes.

In our view here are the reasons for investing in bonds: income, safety, and the stability of principal over an intermediate time period. Despite the sell-off of recent weeks, quality municipal bonds still hold the characteristics that make them alluring to investors. They offer a cushion against stock market volatility, security of principal and a steady income stream exempt from federal income taxes. 

Clearly, today’s market requires a high degree of credit discrimination. We have long stated that “municipal bonds are not all created equal” and focused our credit research expertise on the “three pillars”: underlying credit quality, deal purpose and deal structure. This credit discipline is critical in today’s market.

The municipal bond market is arcane and idiosyncratic and that is not going to change anytime soon. This dynamic provides excellent investment opportunities for the committed, income oriented investor. Generally speaking, today’s current market offers excellent value.

Examine Bernardi Securities, Inc. composite portfolios’ 12 year performance numbers and you see consistent, increasing value over many different market cycles. As disquieting as it is to see a 6/30/2013 portfolio valuation down from its earlier year value, the paper losses will be partially offset in the coming months by greater monthly cash flows as reinvestment occurs. Over time this changing dynamic is a positive for income oriented bond portfolios. If you are not convinced, review the value of your bond portfolio as of 10/31/2008 and then again its value 7 to 9 months later. Additionally, some of the best performing bonds in your portfolio today are those bought in late 2008 and early 2009 when bond prices declined significantly.

The bond market sell-off last quarter reminded us again — a separate account, quality, laddered bond portfolio strategy works very well for income-oriented investors who do not have a short-term perspective.

Thank you for your continued confidence in our bond portfolio research and management process. Please call us if you would like to review the portfolio or if you have any questions.

Sincerely,
Ronald P. Bernardi
President and CEO
August 14, 2013



BSI__Formas_Slide.jpg

Below are several credit research notes related to the City of Detroit.  Our goal with this commentary is to frame the relevant general obligation bond issue and clearly articulate our credit perspective. 

  • Detroit HAS NOT been on our firm’s list of approved credits for decades.  As a result, our portfolio managed clients have ZERO exposure to Detroit.  Detroit’s deteriorating credit quality has been discernible for decades.  For instance, since 1988, Detroit has run a deficit in the city’s total governmental funds (including transfers and bonds proceeds), SEVENTEEN TIMES. During that same period Detroit has been able to string together two consecutive surpluses only TWICE.  
  • Missteps.  The emergency manager (EM) declared in June that the city’s unlimited tax, general obligation (UTGO) bonds were considered “unsecured”.  By placing bondholders in the same pool as other general creditors it sent a clear message that a bankruptcy filing was imminent.  Perhaps the EM’s posturing was a negotiating ploy, but in our view it represented a serious misstep.  Consider the following: outstanding UTGO bonds total an estimated $500 million, while pensioners and other creditors holding special revenue obligations, pension related certificates of participation and swaps are owed approximately $16 billion.  This disparity demonstrates that unlimited tax, general obligation debt is not the root of Detroit’s financial problems.  Yet, the EM has indicated there is a willingness to spurn UTGO bondholders.  Offering UTGO bondholders a recovery rate of 20 cents on the dollar, while maintaining a coveted art collection worth an estimated $2.5 billion is alarming. 
  • Bankruptcy.  Detroit’s decision to petition a FEDERAL bankruptcy judge to decide which creditors have superior liens suggests local political leaders lack the fortitude to address the city’s financial issues.  Furthermore, the city’s diminished view of “unlimited tax, full faith and credit, without limitation…” has forced bondholders to question the true definition.  In our view this necessitates a Chapter 9 filing in order to answer (and re-affirm) the question on a legal basis, rather than political.  That said the Chapter 9 process will be long and costly for the city.  Recoveries aren’t blossoming in Vallejo, California, Stockton, California or Jefferson County, Alabama.  Personal bankruptcies are demoralizing and have lasting financial affects, municipal bankruptcies are no different.
  • Michigan credit view.  The EM’s position regarding Detroit’s UTGO debt does affect how we view ALL other Michigan LTGO and UTGO bonds.  We are mindful that it is only the EM’s “opinion”.   However, as a consequence and until a federal bankruptcy judge opines or state legislature takes specific actions re-affirming the elevated security status of UTGO and LTGO bonded debt relative to other creditors, we have pulled back from the Michigan G.O. market.  We expect a legal authority to address the security priority of various creditors.   To that end, it is disappointing that the Governor and Michigan legislators have not led on this issue; contrast Detroit’s Chapter 9 filing with Central Falls, R.I. and Governor Chafee and the Rhode Island legislature which enacted a law stating general obligation bonds have a priority status on Chapter 9 filings.
BSI_Slide_JIrish.jpg
BSI_RBernardi_Slide.jpg


A MIXED MESSAGE FROM THE FED

Federal Reserve Chairman Ben Bernanke appeared before the Joint Economic Committee on Wednesday, May 22 and offered this testimony:

“For some months, the FOMC has been buying longer-term Treasury securities at a pace of $45 billion per month and agency MBS at a pace of $40 billion per month. The Committee has said that it will continue its securities purchases until the outlook for the labor market has improved substantially in a context of price stability…….At its most recent meeting, the Committee made clear that it is prepared to increase or reduce the pace of its asset purchases to ensure that the stance of monetary policy remains appropriate as the outlook for the labor market or inflation changes.”

“Clarity” is a word rarely used to describe Fed speak; oftentimes clarity requires singularity. The Chairman’s May testimony lacked both, was confusing to many and it upset both stock and bond markets. To us, there is a disconnect between present day bond yields and non-Fed induced macro-economic reality.

Our suggestion to income oriented, mattress money bond investors: NOW IS NOT THE TIME TO DEVIATE FROM A WELL THOUGHT OUT BOND PORTFOLIO STRATEGY AND REACH FOR YIELD, INCREASE PORTFOLIO DURATION BEYOND NORMAL LIMITS OR INVEST IN UNTESTED, HYBRID DERIVATIVE INVESTMENT BOND PRODUCTS.

To make the point, we share with you again our August 2007 writing, “The Bond Market Can Intimidate Everyone”. Granted, much time has passed since late summer of 2007 and today’s financial market landscape would have been unimaginable by most back then. Yet, several parallels of the two time periods exist and are noteworthy, in our view.

“What’s past is prologue”, to quote a favorite bard of ours; perhaps the summer of 2007 offers a clue as to what lies ahead for some bond investors.

SOME PROGRESS IN ILLINOIS WITH MUCH WORK TO DO

The dismal days of March have passed and this month brought some good news to the Prairie State. On May 9, the state auctioned $300 million taxable, sales-tax backed bonds rated “AAA” by Standard & Poor’s. There were 11 separate bids with the winning bidder submitting a true interest cost bid of 3.286%. The 10 year maturity initially yielded 2.60% approximately 80 basis points greater than the yield on the 10 year U.S. Treasury bond at the time.

In comparison, last month the state issued lower rated, taxable general obligation bonds and paid 4.31% for the 10 year bond. That yield was 245 basis points over the 10 year Treasury rate at the time. Clearly, the state paid an interest rate penalty to borrow on its general obligation bond pledge.

May’s auction results were a positive development underscoring the fact certain investors are seeking strongly structured, quality bonds and are willing to lend at low rates for issues like the state’s sales-tax backed bonds.

Additionally, the state began the fourth quarter of its fiscal year in April with $8.5 billion in unpaid bills and was able to reduce the backlog to $5.8 billion by May 1st. An infusion of tax revenue was primarily responsible for the decline. This too is a positive development, although the scheduled, partial expiration of a recent income tax increase for fiscal 2015 suggests the backlog will increase absent balanced operating budgets and a solution to the state’s underfunded and growing pension shortfall.

THE HOUSE MOVES ON PENSION REFORM

The urgency for pension reform cannot be understated: annual pension payments will increase by $900 million next year to $6 billion. This sum represents about 17% of the state’s general fund. This past month NASRA published a national study that found about 3% of all state and local government spending is used to fund public pension benefits. The study found Illinois governmental units are allocating 4.89% on average to fund public pension benefits.

On Thursday, May 2 the Illinois House passed a pension reform package sponsored by House Speaker Michael Madigan by a vote of 62-51. Plan sponsors claim the reform measure will reduce the current $97 billion unfunded pension shortfall by $30 billion with overall savings of $150 billion over a 30 year period at which time it would be fully funded. Currently, the state’s public employee retirement systems are approximately 43% funded.

The bill limits annual cost of living increases and raises the retirement age for state employees currently under 45 years of age. It caps benefits and phases in a 2% increase in employee contributions over a two year period and it strengthens the pension payment commitment from its appropriation status to second in stature only to debt service payments.

Governor Pat Quinn and many Democratic legislators support the bill as do House Republican leaders Tom Cross and Senator Christine Radogno. A coalition of public employee unions oppose the bill.

THE SENATE MOVES ON PENSION ISSUE TOO- SHOWDOWN LOOMS

One week after the House passed its pension reform bill, the Senate approved its version of pension reform (Senate Bill 2404) by a vote of 40-16. The Senate bill is less comprehensive than the House bill. The proposal is projected to save approximately $46 billion in pension costs over the next 30 years and trim about $10 billion off the state’s $97 billion of unfunded liabilities. Recently, the state’s pension system released its calculations of the bill’s savings showing only $5 billion in savings, 50% less than projections. The Senate bill calcualtes the plan will be 90% funded in 30 years. The plan offers employees a set of choices of health care and retirement options.

Senate President John Cullerton believes his plan is consistent with the state’s constitution. He believes the House bill is unconstitutional. AFL-CIO Illinois President Michael Carrigan supports the Senate plan while the Illinois Retired Teachers Association opposes it and threatens to file a lawsuit if it is signed into law.

The constitutional issue is far from simple. Both Mr. Madigan and Mr. Cullerton believe their plans will stand up to any constitutional challenges.

Substantive progress needs to be made on this issue. We will have to wait and see how this plays out.

Please call us with your questions and comments.

Sincerely,
President and CEO
Bernardi Securities, Inc.
Ronald P. Bernardi
May 30, 2013